Purpose of this marketing funnel template
This template is designed to streamline the analysis of cross-channel marketing campaigns by consolidating performance metrics into a single, interactive view. It replaces manual data aggregation with automated Python scripts that normalize disparate data sources for accurate reporting.
- Centralizes raw performance data: Aggregates metrics from multiple channels, such as Google Ads, Facebook, and LinkedIn, into one unified dataset.
- Visualizes the complete customer journey: Maps the conversion path from top-of-funnel impressions down to final revenue.
- Calculates real-time ROI: Computes critical financial metrics, including Return on Investment (ROI), Cost Per Lead (CPL), and advertising cost of sales, using Python logic.
- Provides automated insights: Delivers text-based performance summaries generated via AI-driven prompts to interpret trends without manual analysis.
Data sheet structure
The foundation of this template is the data sheet, which houses the raw performance metrics required for visualization. Users input their campaign statistics here to drive the dashboard calculations.
- Raw data input: All campaign information is stored in the 'data' sheet.
- Structured table: Data is organized within the 'Marketing_Data' table, spanning columns A through I. This structure ensures that Python scripts can reliably reference the dataset.
- Required fields: The table includes standard marketing columns: Date, Channel, Campaign Name, Ad Spend, Impressions, Clicks, Leads, Conversions, and Revenue.
- Sample data: The template comes pre-populated with 30 rows of multi-channel campaign data from March 2024 to demonstrate proper formatting.
Dashboard visualization components
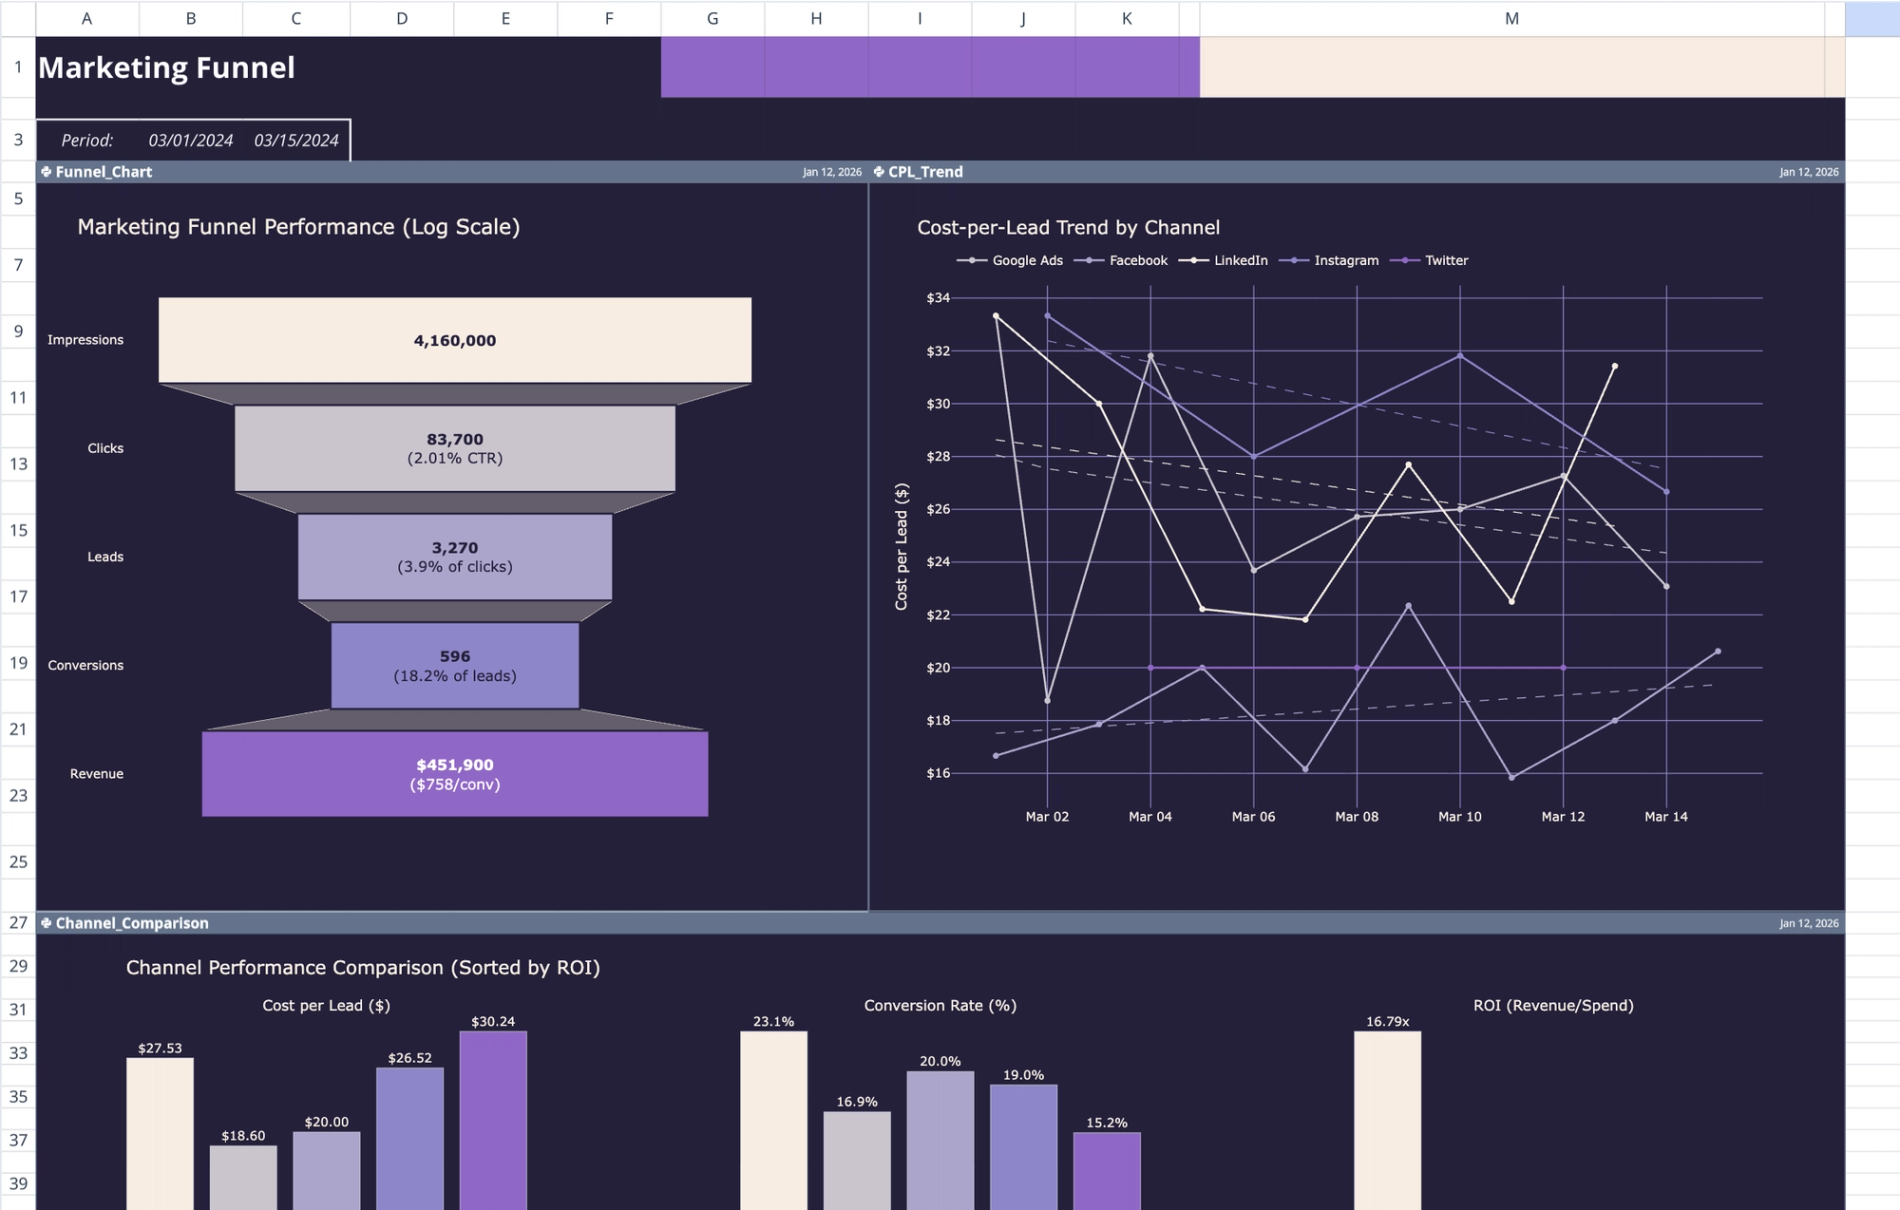
The Dashboard sheet acts as the analytical front-end, using Python and Plotly to render interactive marketing data visualizations. These visualizations update dynamically based on the inputs in the data sheet.
- Header metrics: The top section (A1:C3) displays the report title and calculates the date range covered by the current dataset.
- Funnel chart: Located at A4:H26, this chart visualizes conversion rates at every stage, helping identify drop-off points between impressions and sales.
- CPL trend analysis: The chart at I4:N26 tracks cost-per-lead fluctuations over the reporting period, allowing users to monitor spending efficiency.
- Channel comparison: Spanning A27:N49, this component contrasts performance across different platforms (e.g., Facebook vs. Google Ads) to highlight high-performing channels.
- ROI bubble charts: Two visualizations (A50:K72 and A73:K95) plot return on investment against spend and volume, using bubble size to represent magnitude.
AI-generated performance reporting
Beyond visual charts, this template includes a text-based reporting engine that uses AI to summarize findings. This feature allows for narrative insights to be generated directly alongside quantitative data.
- Prompt configuration: Natural language instructions are stored in cells M51:M52. These cells tell the AI what specific metrics to focus on, such as "summarize channel rankings."
- Python execution: The 'Performance_Report' cell (M54:M87) reads both the configuration prompts and the 'Marketing_Data' table to process the request.
- Automated outputs: The script generates formatted bullet points covering key insights, such as channel ROI rankings and budget optimization recommendations.
- Dynamic updates: Because the report is generated via code, the narrative automatically adapts whenever the underlying table data or the prompt instructions are modified.
How to use this editable marketing funnel template
This template is built for customization, allowing users to swap sample data for live campaign figures and adjust the analytical logic as needed.
- Input data: Clear the sample rows in the 'Marketing_Data' table on the data sheet and paste in actual campaign figures. Ensure the column headers remain consistent.
- Refresh calculations: Quadratic’s Python cells automatically pull the new data to update the Plotly visualizations and header metrics.
- Modify prompts: To change the focus of the text summary, edit the natural language instructions in cells M51:M52. For example, you can ask the AI to focus specifically on "underperforming campaigns."
- Expand categories: Users can add new channels or metrics to the source table. The Python scripts referencing the 'Marketing_Data' table will include these new inputs in the analysis.
Who this marketing funnel template is for
- Digital marketers: Professionals who need to track and report on cross-channel campaign performance efficiently.
- Growth teams: Groups focused on analyzing conversion rates, identifying funnel leaks, and improving cost efficiency.
- Marketing analysts: Users requiring a flexible digital marketing funnel template that allows for custom Python logic and granular data manipulation.
- Freelancers: Consultants who need a professional, free marketing funnel template structure to standardize client reporting.
Use Quadratic to analyze marketing funnel performance and ROI
- Consolidate cross-channel campaign data from platforms like Google Ads and Facebook into one unified dataset.
- Visualize the entire customer journey and conversion rates to pinpoint drop-off points.
- Automate real-time ROI, CPL, and other critical financial metric calculations with Python.
- Generate AI-driven text summaries and performance reports directly from your campaign data.
- Dynamically update interactive dashboards and visualizations with new campaign inputs instantly.
- Customize analytical logic and expand data categories to fit your evolving marketing needs.
Related templates
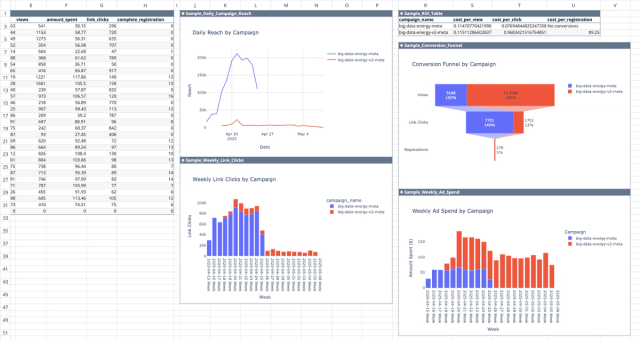
Meta Ads API Analytics Template
Get better insights from your Facebook ad campaigns with direct integration with the Meta Ads API.
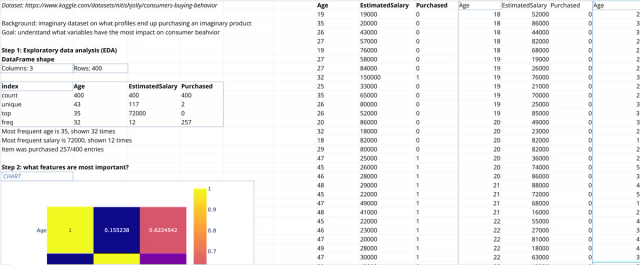
Consumer Behavior Analysis Template
Study consumer purchasing behavior to target the right consumers.
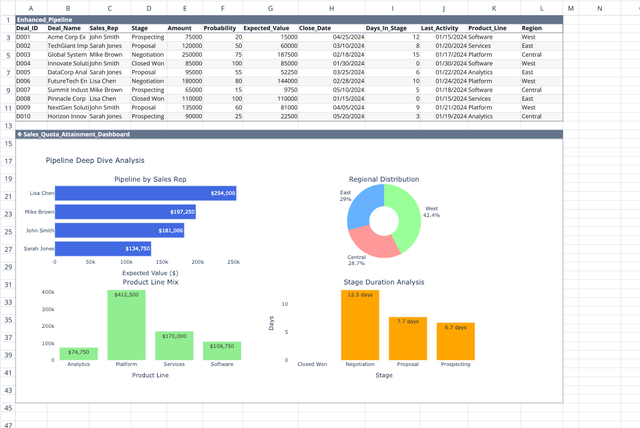
Sales Quota Calculator
Track quota attainment and forecast sales performance.