Purpose of the projectile motion calculator
This template serves as a comprehensive tool for modeling and analyzing 2D kinematic trajectories. It is designed to bridge the gap between static calculations and dynamic visualization, allowing users to verify physics concepts instantly.
- Calculates key kinematic values: Automatically computes flight duration, distance, and peak altitude based on user inputs.
- Visualizes the flight path:Generates an interactive Plotly chart to display the parabolic trajectory.
- Integrates formulas with Python: Demonstrates how standard spreadsheet formulas can work in tandem with Python scripting for advanced plotting.
- Provides a reactive environment: Enables users to test different launch scenarios—such as changing gravity or launch angle—and see immediate visual and numeric results.
Template components and layout
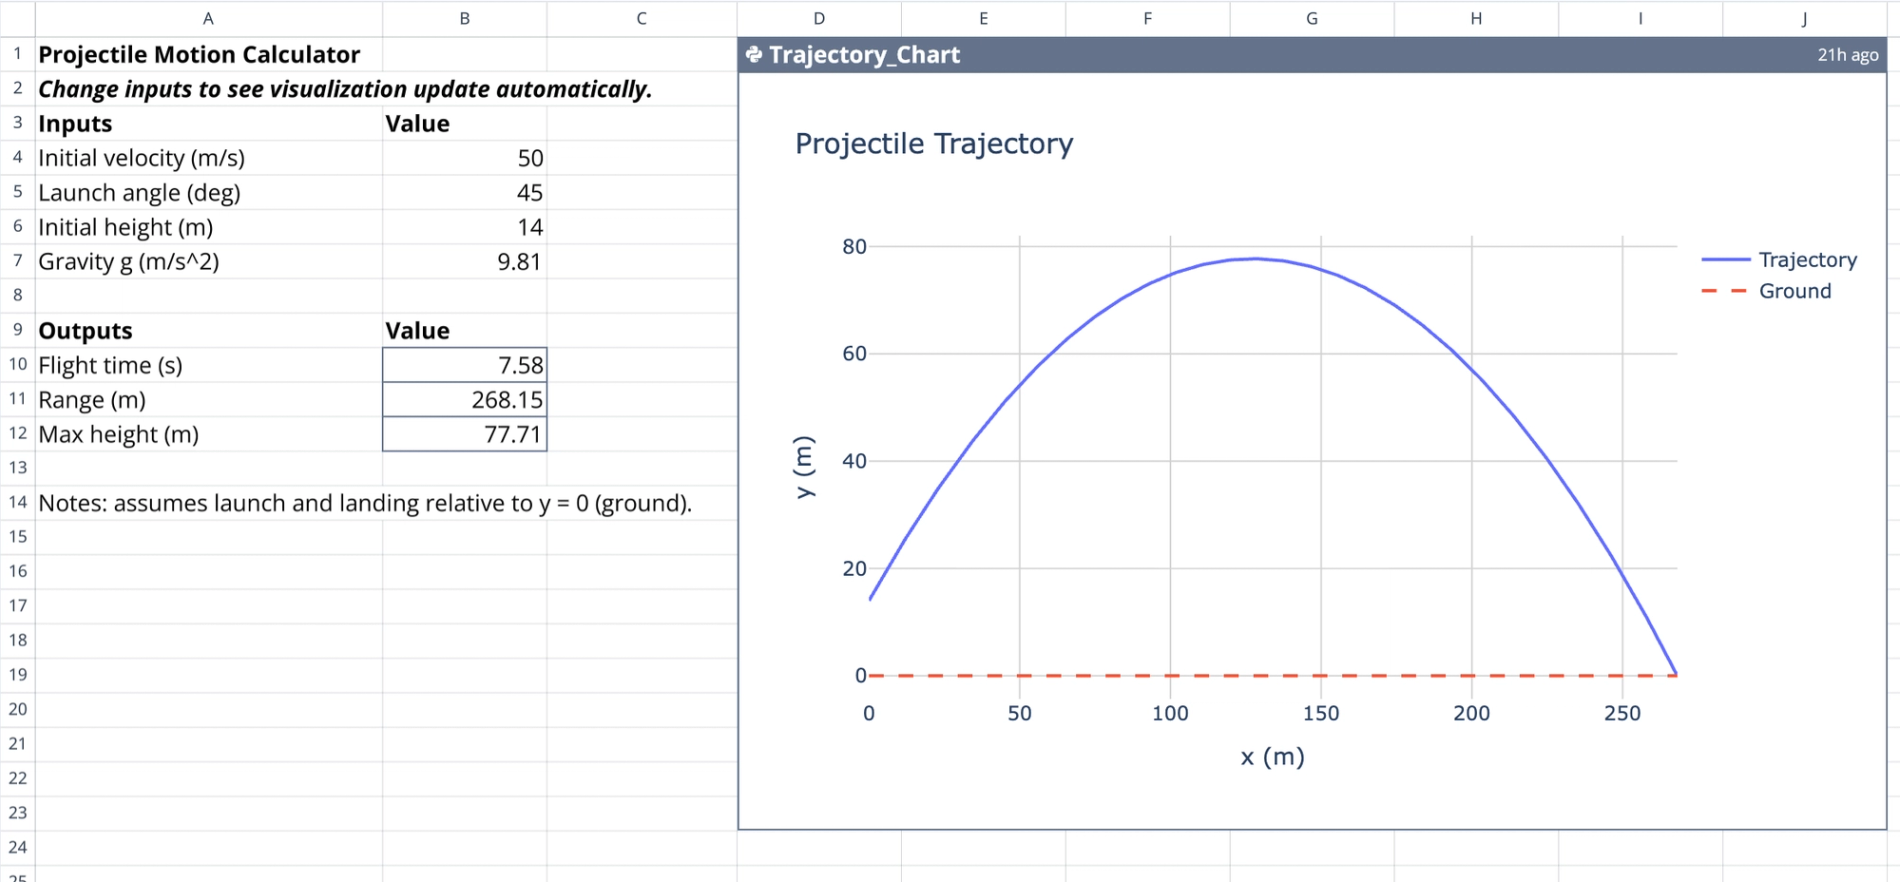
The template is organized into a clear input-output structure on the left, with the visualization occupying the remaining space.
- Input parameters
- Designated input section: Columns A through C (rows 3-7) contain the variable fields.
- Launch variables: Users specify the initial velocity in meters per second and the launch angle in degrees.
- Environmental variables: Users define the initial height in meters and the gravitational acceleration ($g$).
- Computed outputs
- Total flight time: Calculates the duration of the flight in seconds until the projectile hits the ground.
- Horizontal range: Determines the total distance traveled along the x-axis.
- Maximum height: Solves for the peak vertical displacement achieved during the trajectory.
Mechanics of the calculation
The projectile motion calculator leverages a hybrid approach, using spreadsheet formulas for high-precision numeric data and Python for data visualization.
- Formula-based logic
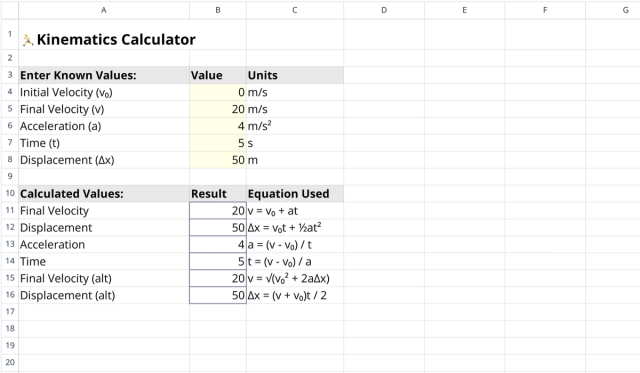
- Standard physics equations: The output cells utilize standard kinematic formulas to calculate time, range, and height.
- Direct referencing: Formulas reference input cells directly, ensuring instant recalculation when variables change.
- Ground-level landing: The logic accounts for the projectile landing at $y=0$, accurately calculating flight time even when the launch height is elevated above ground level.
- Python integration
- Data retrieval: The Python code cell uses
q.cells()to pull input values directly from the spreadsheet grid. - Vector decomposition: The script converts the launch angle to radians and decomposes the initial velocity into horizontal ($v_x$) and vertical ($v_y$) components.
- Smooth plotting: The code generates 300 evenly spaced time samples to create a smooth, high-resolution trajectory curve.
- Synchronization: To ensure the chart matches the numeric outputs, the Python script retrieves the pre-calculated flight time from the spreadsheet rather than recalculating it independently.
How to use the template
1. Enter launch variables: Input your specific parameters (velocity, angle, initial height, and gravity) into the defined rows in column B.
2. Observe numeric updates: Watch as the output cells in rows 9-12 immediately recalculate flight time, range, and maximum height.
3. View the trajectory: The Trajectory_Chart automatically updates to display the new parabolic curve based on the modified inputs.
4. Inspect data points: Hover over the interactive Plotly graph to view exact coordinate points ($x, y$) at any stage of the flight.
Who this Projectile Motion Calculator is for
- Physics students: Ideal for studying kinematics and verifying answers for 2D motion problems.
- Educators: Useful for demonstrating the effects of changing angles or gravity on a projectile's path in a visual, interactive manner.
- Engineers: Provides a quick, code-backed verification tool for estimating motion parameters without setting up complex simulation software.
Use Quadratic to Calculate and Visualize Projectile Motion
- Instantly calculate key kinematic values like flight duration, horizontal range, and maximum height.
- Visualize parabolic trajectories with interactive Plotly charts that update in real-time.
- Test various launch angles, initial velocities, and gravitational forces to observe immediate numeric and visual changes.
- Combine standard spreadsheet formulas with Python scripting for precise calculations and smooth, synchronized plotting.
- Inspect exact coordinate points along the flight path directly within the interactive graph.