Overview of the recruitment funnel dashboard
This template functions as a comprehensive recruitment funnel dashboard, leveraging spreadsheet automation to visualize hiring pipelines without the need for complex business intelligence tools. By separating raw data storage from the visualization layer, it ensures that data entry remains streamlined while the resulting analytics remain dynamic and robust.
The dashboard integrates Python directly into the grid, functioning as a true python spreadsheet to generate real-time charts and text-based analysis. It tracks critical metrics, including stage conversion rates and source effectiveness, transforming raw applicant logs into clear visual indicators of pipeline health.
Data sheet structure
All input data is housed in the 'data' sheet within a single table named 'Applicant_Data', spanning the range A1:J22. This table serves as the single source of truth for all visualizations and calculations on the dashboard.
To ensure accurate analysis, the table requires specific inputs:
- Identity fields: applicant_id, role, and source.
- Date tracking: Columns for application_date, screen_date, and offer_date to measure velocity.
- Status tracking: Columns for current_stage and outcome to define the candidate's position in the funnel.
Dashboard visualization components
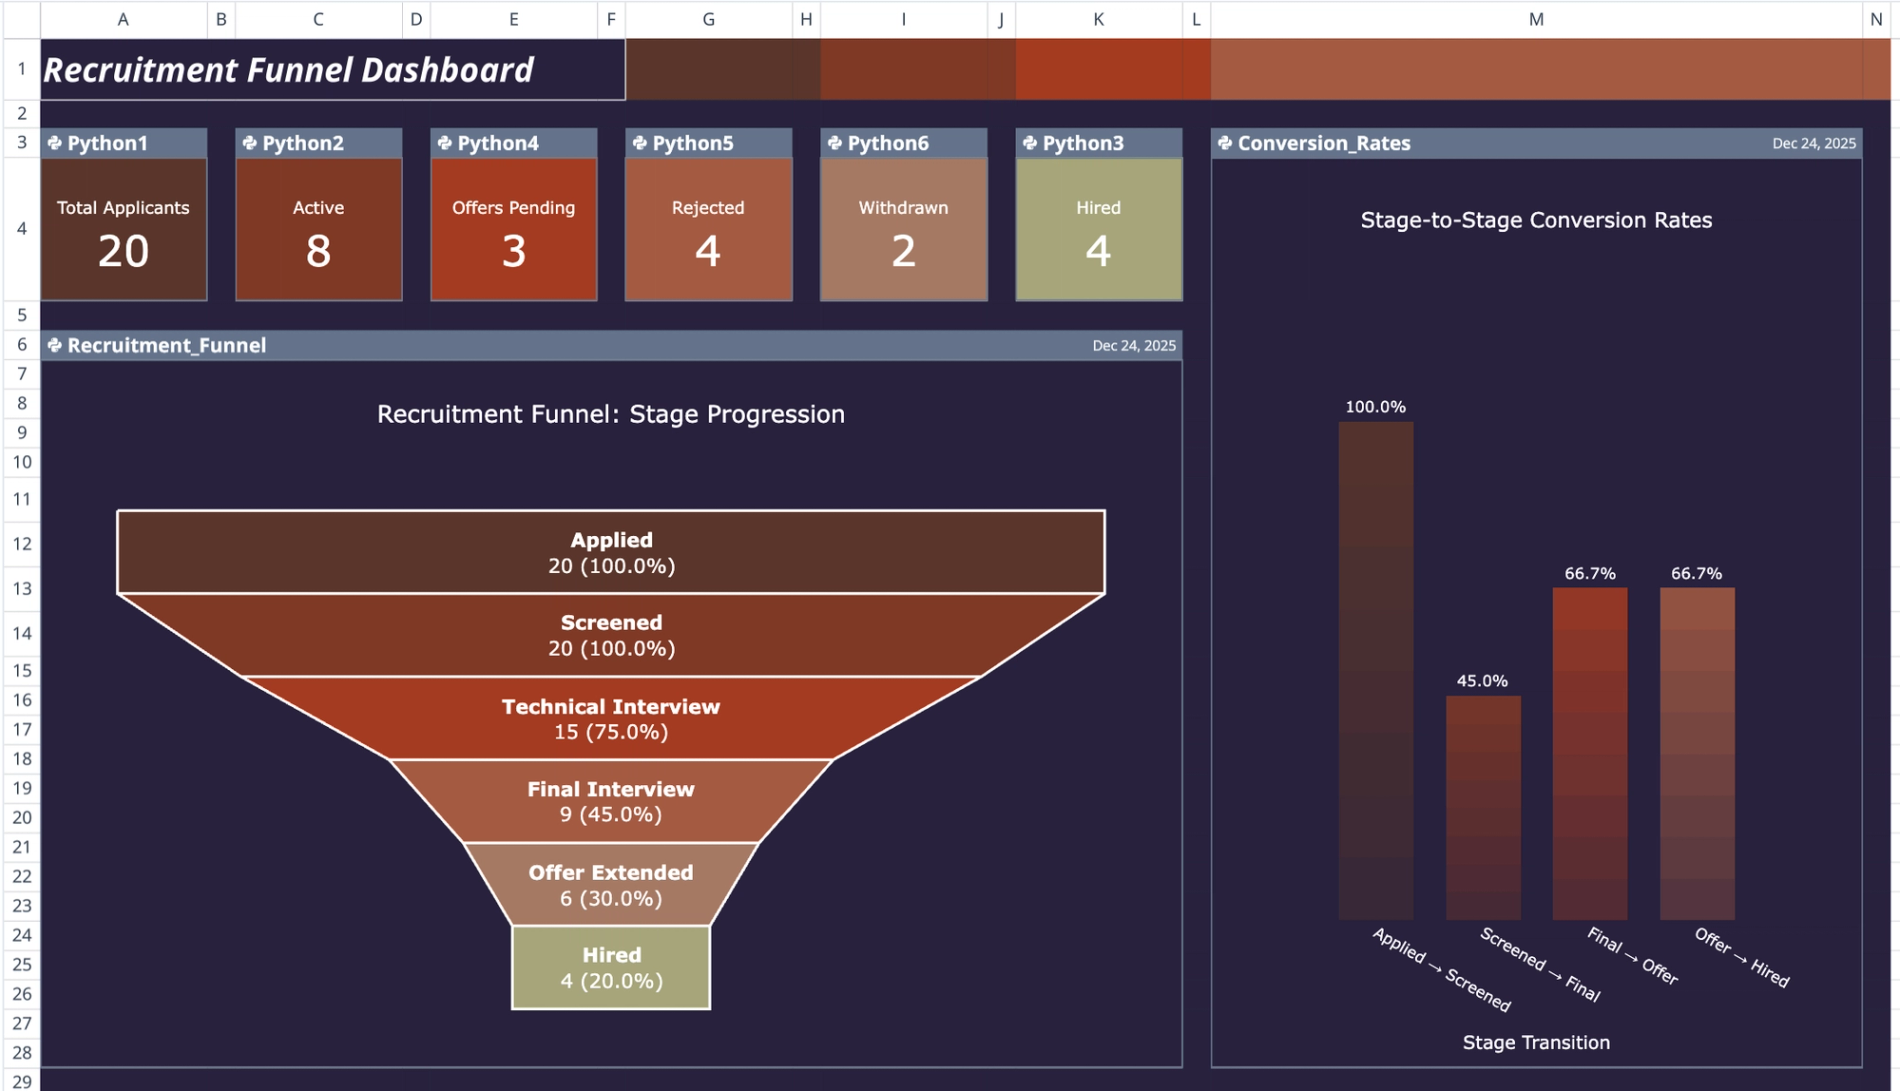
Key performance indicators
The top row of the dashboard features Python-generated KPI cards positioned across columns A through K. These metrics provide immediate visibility into high-level pipeline health, summarizing total active candidates and overall volume at a glance.
Pipeline and conversion charts
The primary visual component is the 'Recruitment_Funnel' chart, which displays candidate volume organized by stage. This visualization helps users quickly identify where the majority of candidates are situated. To the right, the 'Conversion_Rates' vertical chart illustrates drop-off percentages between specific stages, allowing for the visual identification of pipeline bottlenecks.
Time and source analysis
Deeper analytical metrics are displayed in the lower section of the dashboard:
- Stage_Duration_Box: A box plot that analyzes time-to-hire distributions, helping users spot outliers and understand average delays.
- Source_Effectiveness: A chart that compares hiring channel performance, correlating specific applicant sources with successful hiring outcomes.
Automated insights and recommendations
The 'Funnel_Analysis' Python cell, through its automated data processing, interprets the pipeline data. Using internal logic, it calculates specific conversion rates and time averages, outputting a formatted text analysis directly onto the sheet.
- Text-based ranking: Generates a clear ranking of recruitment sources based on effectiveness.
- AI-driven recommendations, a key component of AI spreadsheet analysis, produces actionable advice based on data patterns, such as identifying stages with unusually high rejection rates.
- Customizable logic: The analysis is guided by a prompt structure in cell M31, which users can modify to customize the focus of the insights.
How to use this recruitment funnel dashboard
To use the dashboard, begin by entering new candidate records into the 'Applicant_Data' table in the data sheet. It is critical to ensure that date formats and stage names remain consistent across all records to prevent errors in the visualization layer.
Once the data is updated, refresh the Python cells to instantly update the charts and KPIs. Users can also modify the text prompt in cell M31 to change the context of the automated analysis, tailoring the recommendations to focus on specific business goals or timeframes.
Who this recruitment funnel dashboard is for
- Talent acquisition managers: For tracking team performance and monitoring pipeline volume.
- HR operations specialists: For analyzing time-to-hire metrics and identifying process inefficiencies.
- Recruiting agencies: For reporting pipeline health and conversion data to clients.
Use Quadratic to build a recruitment funnel dashboard
- Visualize your entire hiring pipeline in a single, dynamic view.
- Track stage conversion rates and source effectiveness with real-time charts.
- Pinpoint pipeline bottlenecks and analyze time-to-hire distributions.
- Compare recruitment channel performance to optimize your sourcing strategy.
- Generate automated text analysis and AI-driven recommendations from your data.
- Customize analysis logic and recommendations by modifying in-sheet prompts.