
Financial reporting accuracy often suffers from a hidden complexity: the commingling of finalized revenue and potential revenue. When sales teams celebrate booked orders, finance teams must determine how much of that capital is actually available. Mixing paid and unpaid order data in the same dataset can artificially inflate revenue metrics and obscure the reality of cash flow. This is where accounts receivable analytics becomes critical.
Accounts receivable analytics is the process of interpreting transactional data to understand exactly how and when money flows into the business. It moves beyond simple aging reports to provide a granular view of payment behaviors, bottlenecks, and outstanding liabilities, often measured through metrics like Days Sales Outstanding (DSO). For business analysts and finance managers, the challenge is rarely a lack of data. The challenge is transforming raw sales logs—containing order counts, amounts, and mixed statuses—into a clean, segmented accounts receivable analytics report.
Effective financial insight requires a strict separation of church and and state: paid orders must drive revenue metrics, while unpaid orders must be isolated for rigorous follow-up. This article details a practical workflow for executing this segmentation, transforming messy transactional logs into professional, decision-ready reports.
Why data segmentation is vital for accounts receivable analytics
In many organizations, "sales" and "revenue" are used interchangeably in conversation, but they represent distinct financial states. Booked revenue represents a contract or a promise to pay. Cash in hand represents the fuel for operations. When a unified dataset combines these two states without clear segmentation, reports become muddy. A spike in "sales" might actually be a spike in "orders pending shipment" or "payment failed" statuses, which helps neither payroll nor procurement.
Applying accounts receivable data analytics allows finance teams to break these metrics apart. By isolating unpaid orders, analysts can identify specific friction points in the order-to-cash cycle. For example, if a significant portion of unpaid orders is stuck in a "Shipped but Unpaid" status, the issue lies in collections. If the bottleneck is "Pending Shipment," the issue is operational.
The impact of this segmentation is twofold. First, it ensures accuracy in cash reporting, preventing the business from making decisions based on money it does not yet have. Second, it drives actionability. A segmented report allows the accounts receivable team to target specific subsets of unpaid orders rather than chasing a generic list of outstanding invoices.
Step-by-step: building an AR analytics workflow
The following workflow outlines how a Business Analyst can take raw transactional data and build a sophisticated reporting structure. This process utilizes Quadratic, a modern spreadsheet that integrates Python and SQL, to handle the logic and formatting that traditional tools often struggle to automate.
1. Consolidating transactional sales data
The foundation of data analytics for accounts receivable is data integrity. The workflow begins with the ingestion of raw transactional logs. In this use case, the analyst starts with a comprehensive dataset that includes order counts, total amounts, payment status, shipment status, and overall order status.
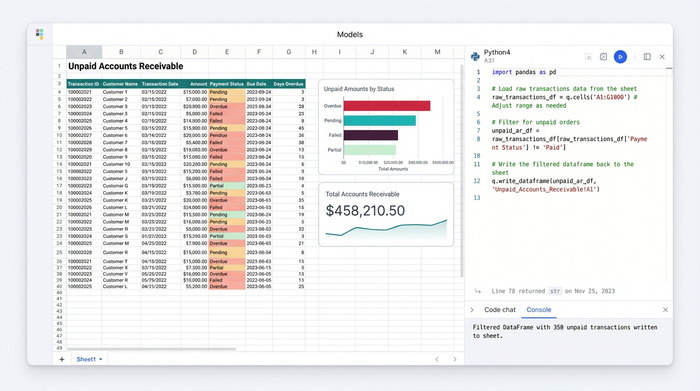
Raw data is rarely ready for presentation. It often arrives as a CSV export or a direct SQL query result, containing thousands of rows where paid and unpaid transactions sit side by side. The analyst’s first task is to bring this data into a workspace where it can be manipulated without altering the source of truth. By importing this data into Quadratic, the analyst can reference the live dataset using SQL queries or Python scripts directly within the grid, ensuring that the analysis always reflects the most current transaction logs.
2. Segmenting paid vs. unpaid orders
Once the data is consolidated, the core task is segmentation. The goal is to create two distinct buckets of information that serve different stakeholders.
The first bucket is for Main Sales Metrics. This segment includes strictly paid orders and serves as the basis for revenue reporting. The second bucket is for Unpaid Order Analytics. This is a detailed view designed specifically for ar accounts receivable management analytics.
Using logical functions—such as SQL queries or Python filtering—the analyst isolates rows where the Payment Status does not equal Paid. This programmatic approach is superior to manual filtering because it is repeatable. As new data flows in, the logic automatically sorts orders into the correct category. The analyst can further refine the unpaid segment by grouping data based on specific statuses, such as "Awaiting Payment," "Payment Failed," or "Net-30 Pending."
3. Formatting for financial insight
Data segmentation provides the logic, but formatting provides the insight. An accounts receivable analytics report must be readable at a glance for CFOs and Operations Leads.
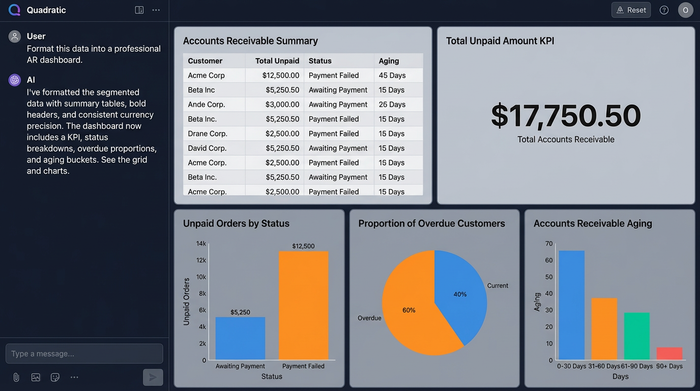
In this workflow, the analyst moves beyond basic rows and columns to create a dashboard-style presentation. Key elements include:
- Summary tables: High-level views that aggregate total unpaid amounts, allowing stakeholders to see the total liability instantly.
- Detailed analytics: A breakdown of unpaid orders categorized by their specific status. This helps teams prioritize which orders need immediate attention.
- Professional formatting: To ensure the report is decision-ready, the analyst applies consistent visual standards. This includes bold headers to distinguish sections, color-coded cells (e.g., highlighting overdue amounts in red), and aligned text for readability.
- Numeric precision: Financial data requires specific formatting. The analyst ensures all currency figures utilize thousand separators and consistent decimal points, eliminating ambiguity.
In Quadratic, this formatting can be applied programmatically or manually, ensuring that even as the underlying data updates, the report maintains its professional structure.
Moving toward predictive analytics in accounts receivable
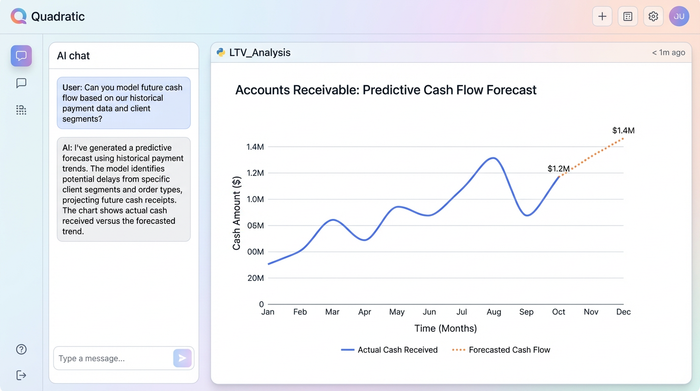
Once a business has mastered the art of describing what has happened—segmenting paid from unpaid—the next logical step is forecasting. Predictive analytics accounts receivable shifts the focus from reporting on the past to anticipating the future.
With a clean, segmented dataset, analysts can begin to model future cash flow. By examining historical trends in the "unpaid" data bucket, finance teams can predict which clients are likely to pay late and which specific order statuses tend to drag on the longest. For instance, if data shows that orders flagged as "Pending Verification" historically take 15 days longer to settle, the finance team can adjust their cash flow forecasts for the coming quarter accordingly.
This predictive capability transforms AR from a reactive function—chasing late payments—into a proactive strategy that mitigates risk before it impacts the bottom line.
Choosing the right accounts receivable data analytics software
Selecting the right tools is essential for executing this workflow efficiently. The market for accounts receivable data analytics software is often polarized. On one end, there are rigid ERP systems that offer stability but lack the flexibility to create custom, segmented views easily. On the other end, traditional spreadsheets offer flexibility but struggle with large transaction logs and complex logic.
Quadratic offers a powerful middle ground for the modern Business Analyst. It combines the familiar interface of a spreadsheet with the computational power of Python and SQL. This allows analysts to handle large datasets that would crash a standard spreadsheet while retaining the ability to format reports with pixel-perfect precision.
Key features to look for
When evaluating software for analytics accounts receivable, prioritize the following capabilities:
- Customizable logic: The ability to define exactly what "unpaid" means for your specific business rules using code or advanced formulas.
- Visual formatting: Features that allow for professional presentation, including borders, specific numeric formatting, and conditional coloring to highlight risks.
- Performance: The capacity to process high-volume transaction logs without latency, ensuring reports are always up to date.
Conclusion
The difference between a thriving business and a cash-strapped one often lies in the visibility of its accounts receivable. By separating paid orders from unpaid liabilities, companies gain a truthful picture of their financial health. Accounts receivable analytics is not just about tracking who owes money; it is about optimizing the entire order-to-cash cycle to ensure resources are focused where it matters most.
Sales and finance leaders should audit their current reporting workflows. Are you mixing your metrics? If your reports commingle paid and unpaid data, you are likely obscuring vital insights. By adopting a segmented approach and utilizing flexible tools like Quadratic, you can transform raw data into a clear, actionable financial narrative.
Use Quadratic to do accounts receivable analytics:
- Consolidate and manipulate raw transactional data: Import large sales logs and reference live datasets using SQL or Python directly within the grid, ensuring analysis reflects current transactions.
- Segment paid and unpaid orders programmatically: Use SQL queries or Python filtering to isolate unpaid orders automatically and repeatably, moving beyond manual filtering.
- Automate professional financial reporting: Apply consistent formatting—including summary tables, detailed breakdowns, and numeric precision—programmatically, so reports stay professional even with updated data.
- Handle high-volume transaction logs with ease: Process large datasets that would overwhelm traditional spreadsheets, maintaining speed and accuracy for up-to-date accounts receivable insights.
- Build custom, flexible AR analytics views: Define specific business rules for "unpaid" using integrated code, enabling tailored reports that go beyond rigid ERP systems.
Start optimizing your accounts receivable analytics workflow today. Try Quadratic.