
The insurance sector is defined by complexity. Financial professionals in this field do not simply manage numbers; they manage risk, regulatory compliance, and massive volumes of data spanning premiums, claims, commissions, and reinsurance. For years, the industry has relied on standard spreadsheets to handle these critical tasks. However, as data volumes grow, traditional methods often result in version control conflicts, manual copy-paste errors, and significant challenges in reconciling data across disparate sources.
To maintain accuracy and efficiency, insurance teams need a modern approach. The solution lies in a data analytics workflow that merges the flexibility of a spreadsheet with the power of code, such as Python and SQL. This combination ensures data integrity by creating auditable, repeatable processes. This article demonstrates a practical workflow for validating financial data and generating decision-ready reports using Quadratic, a tool designed to bridge the gap between technical data analysis and financial reporting.
The role of data analytics in the insurance industry
Data analytics in the insurance industry serves as the backbone of modern decision-making. It transforms raw figures into actionable insights that drive profitability and compliance. Whether a firm focuses on data analytics in health insurance or data analytics in life insurance, the core requirement remains the same: absolute accuracy in financial reporting.
While much of the conversation around analytics focuses on predictive modeling in insurance, such as data analytics in insurance underwriting for assessing risk or data analytics in insurance claims for detecting fraud, the financial backend is equally critical. Finance teams must reconcile the money coming in against the money going out to ensure the general ledger matches operational reality. Without a robust system to handle these reconciliations, the integrity of the entire reporting structure is compromised.
The challenge: Why standard tools struggle with insurance data
Managing big data analytics in insurance is increasingly difficult within the confines of legacy spreadsheet tools. Insurance datasets often exceed standard row limits, forcing analysts to break data into multiple files. This fragmentation leads to versioning errors and makes it nearly impossible to get a unified view of the company’s financial health.
Furthermore, the "integrity gap" in manual reconciliation poses a severe risk. When an associate in insurance data analytics manually ties a claims database to a premiums report using standard lookup formulas, silent errors can occur. A formula might break, a range might not expand to include new data, or a cell reference might shift. These issues often go unnoticed until a report is audited.
Financial professionals need a workflow that is not a "black box" of hidden cell dependencies. They require a system that is transparent, repeatable, and capable of handling complex logic without breaking under the weight of the data.
Step-by-step: A modern workflow for insurance financial reporting
The following workflow illustrates how an insurance finance professional can use Quadratic to validate data consistency, identify discrepancies, and support financial reporting. This approach moves away from manual data manipulation toward a code-enabled, automated process.
1. Ingesting and centralizing financial data
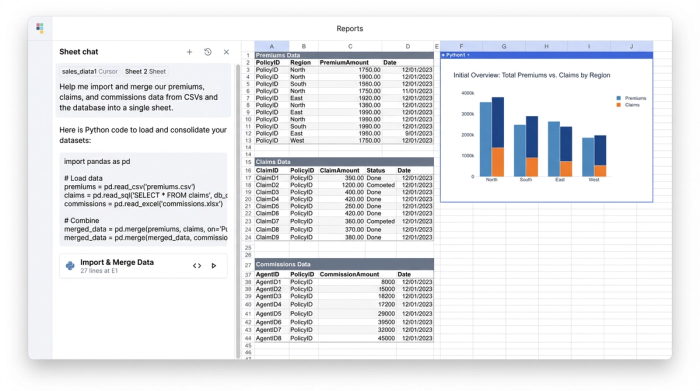
The first step in any robust analysis is gathering the data. In a traditional workflow, this involves downloading CSV files from various admin systems, opening them in separate windows, and attempting to copy-paste them into a master sheet. This process is slow and prone to error.
In Quadratic, you can centralize this data immediately. You can connect directly to databases (such as PostgreSQL or Snowflake) to pull live data, or import large CSV files containing premiums, claims, and commissions history without crashing the browser. By ingesting the raw tabular data directly into the spreadsheet environment, you eliminate the need to switch between tools. The raw data lives alongside your analysis, ensuring that the source of truth is always accessible.
2. Automated validation and discrepancy detection
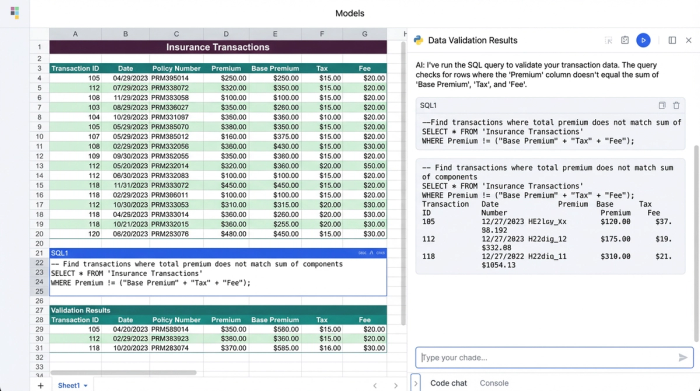
Once the data is centralized, the core task is validation. You need to ensure that the numbers in your claims system match your financial records. Instead of scrolling through thousands of rows or relying on fragile conditional formatting, you can use Python or SQL directly within the sheet to query the data.
For example, you can write a simple SQL query to flag every transaction where the premium amount does not equal the sum of the commission and net revenue. The query instantly filters the dataset, returning only the rows that fail this logic check. This allows for complex, logic-based error checking that instantly highlights data quality issues. If the query returns an empty table, you know your data is clean. If it returns rows, you have an immediate "to-do" list of discrepancies to investigate.
3. Structuring data for analysis
After validation, the data must be structured for reporting. Raw data is rarely in the format required for a monthly or quarterly report. You might need to compare Q3 Claims against Q3 Premiums, but the data is mixed with other periods.
Using SQL queries within Quadratic, you can create clean subsets of data. You can write a query to select specific columns, filter by date ranges, and group by region or product line. This generates well-structured tables with clear headers that update automatically if the underlying raw data changes. This structured approach ensures that your analysis is built on a solid foundation, rather than a fragile patchwork of manual filters.
4. Visualizing insights for decision making
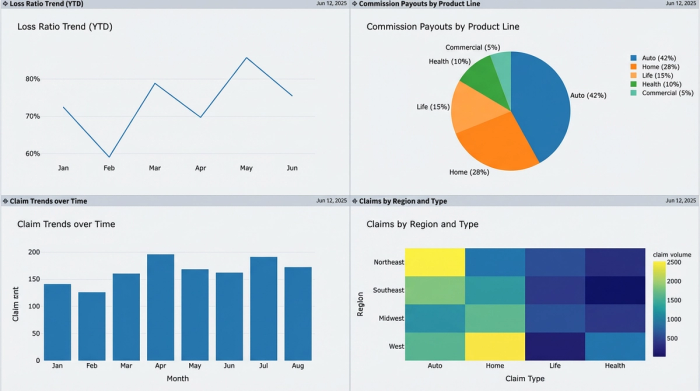
The final deliverable is often a dashboard that management can interpret at a glance. You can create a separate \"Dashboard\" sheet within your Quadratic project to host charts and summary tables.
Because your data is already validated and structured, creating visualizations is straightforward. You can generate charts that track loss ratios, commission payouts, or claim trends over time. These visuals are directly linked to your structured data queries. When you update the raw data for the next reporting period, the charts update automatically, providing a clean, visual representation of financial health that is ready for presentation.
The benefits of a code-enabled workflow
Adopting a workflow that integrates code with spreadsheets offers significant advantages for handling big data analytics in insurance.
The primary benefit is repeatability. In a standard spreadsheet, the reconciliation process often has to be rebuilt or heavily modified every month. In a code-enabled environment, the logic (Python or SQL) is written once. Updating the report for the next month is as simple as refreshing the data connection or importing the new dataset. The logic applies automatically to the new figures.
Transparency is another key advantage. Formulas and code are visible and readable. An auditor or a colleague can look at a SQL query and understand exactly how the data was filtered and aggregated. There are no hidden steps or obscure macros.
Finally, this approach offers scalability. It handles the volume of data required for modern insurance analytics better than legacy tools, allowing teams to work with larger datasets without performance degradation.
Conclusion
Data analytics in insurance requires more than just gathering information; it requires rigorous validation and clear reporting to ensure financial integrity. As the industry faces increasing data volumes and complexity, relying on manual spreadsheet processes is no longer sustainable.
By adopting tools like Quadratic, insurance finance professionals can automate the tedious parts of reconciliation and focus on strategic analysis. This shift allows for greater accuracy, faster reporting cycles, and a significant reduction in operational risk. If you are looking to improve your reconciliation process and gain better control over your data, try Quadratic for your next reporting project.
Use Quadratic to validate insurance financial data and generate reports
- Centralize diverse insurance data: Ingest large premium, claims, and commission datasets directly, or connect live to databases like PostgreSQL or Snowflake, eliminating fragmented files and manual copy-pasting.
- Automate data validation: Use Python or SQL directly within your sheet to instantly identify discrepancies and logic errors (e.g., premium amounts not matching payouts), ensuring data integrity without manual checks.
- Structure data for clear reporting: Apply SQL queries to filter, group, and transform raw data into report-ready tables, comparing Q3 claims against Q3 premiums, with automatic updates for new data.
- Generate dynamic financial reports: Create dashboards with charts and summary tables that automatically update as new data is ingested, providing real-time insights into loss ratios, commissions, and claim trends.
- Ensure repeatability and transparency: Build auditable workflows where validation logic is written once and applied consistently, allowing colleagues or auditors to easily understand how data was processed.
- Scale with growing data: Handle the increasing volume and complexity of insurance data without performance degradation, moving beyond the limitations of legacy spreadsheet tools.
Ready to streamline your insurance financial reporting? Learn more and Try Quadratic.