Determining accurate aircraft values is one of the most complex challenges in asset management. Unlike real estate or standard equity, aviation assets are subject to a volatile mix of market conditions, rigorous maintenance cycles, and non-linear depreciation curves. For finance professionals and asset managers, the stakes are incredibly high. A variance of even a few percentage points in a residual value forecast can represent millions of dollars in exposure.
The problem facing most analysts is that the tools used to calculate these figures have not evolved alongside the complexity of the assets. Many professionals still rely on static spreadsheets or a basic aircraft value calculator found online. While these tools provide a quick number, they often function as "black boxes." They lack transparency, fail to integrate live data, and are notoriously difficult to audit.
To accurately answer the question "what's the value of my aircraft," analysts need a model that separates inputs from logic and integrates external factors like maintenance reserves and market trends. This is where moving from a standard spreadsheet to a "glass box" valuation model in Quadratic transforms the workflow. By combining the familiarity of a spreadsheet with the power of Python and SQL, analysts can build models that are auditable, automated, and dynamic.
Moving beyond the "free aircraft value calculator"
A free aircraft value calculator is a useful tool for a general aviation enthusiast looking for a ballpark figure on a Cessna. However, for capital asset management involving turboprops, business jets, or commercial liners, these calculators are insufficient. They typically rely on static averages and fail to account for the specific configuration of the asset, its maintenance status, or the ancillary costs that drastically affect the bottom line.
Professional valuation requires a deep dive into aircraft residual value projections over time. This involves complex depreciation logic that standard spreadsheets struggle to handle without becoming a web of fragile links and hidden formulas.
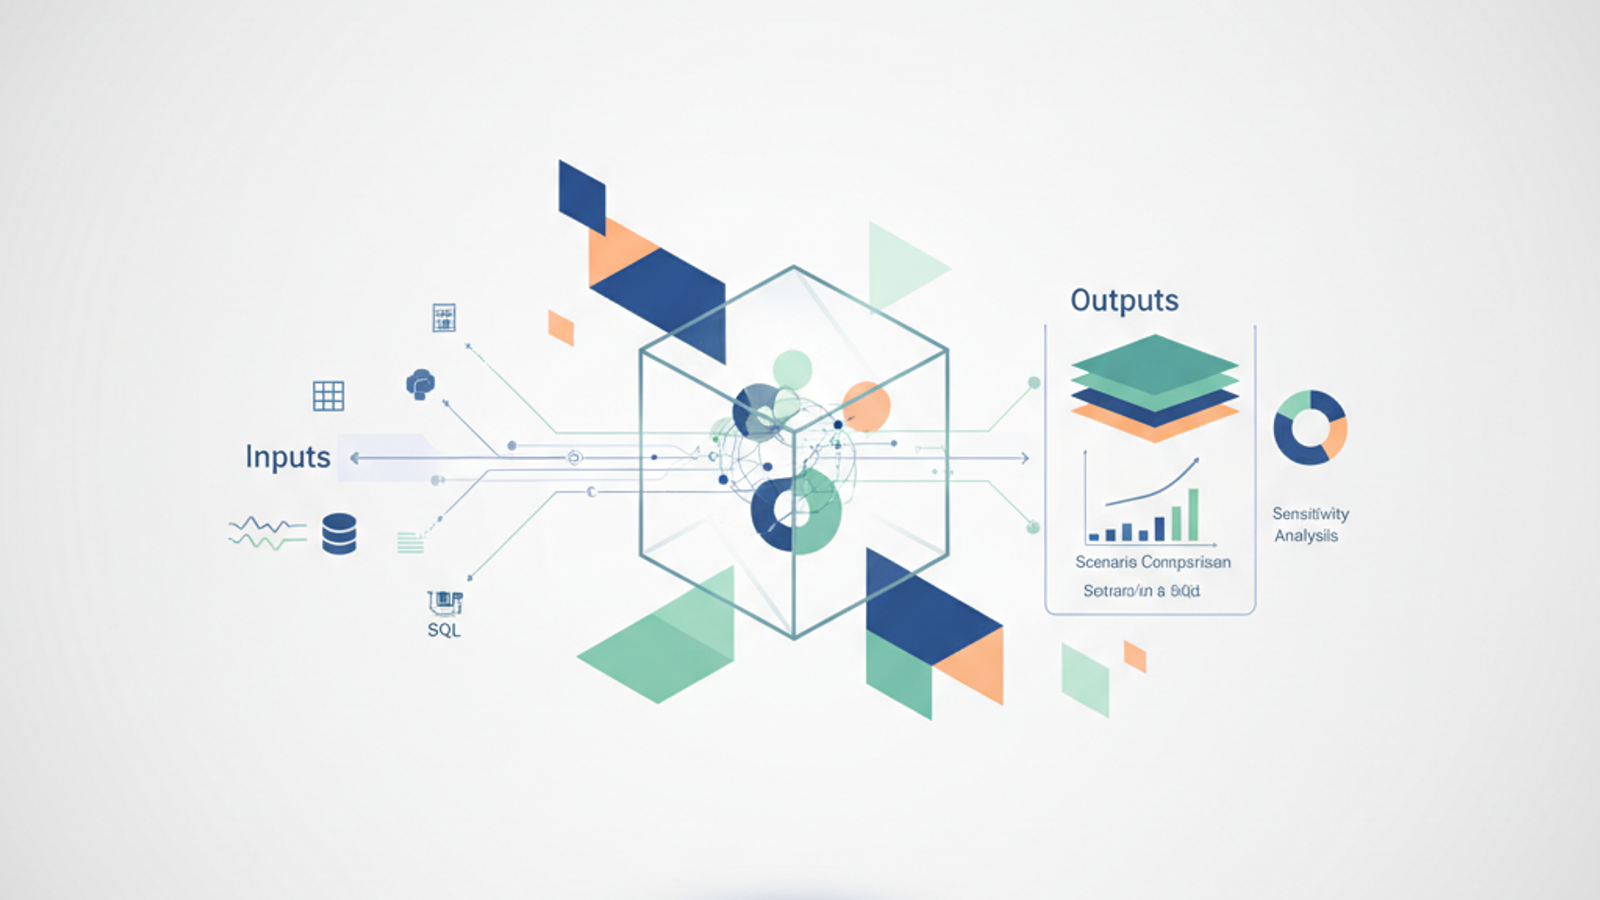
In a robust Quadratic workflow, the valuation model is structured to prevent the "spaghetti code" common in traditional Excel sheets. The model is separated into three distinct environments: Inputs, Calculations, and Outputs. By isolating the data entry from the logic, analysts ensure that the underlying formulas remain protected and consistent, regardless of how many different scenarios are run.
Step 1: Integrating data sources (VREF and market data)
One of the biggest inefficiencies in traditional valuation modeling is the manual handling of data. Analysts often find themselves copying and pasting VREF aircraft values or market comparables from PDF reports or websites into their spreadsheets. This process is not only tedious but also introduces a high risk of human error. Furthermore, as soon as the data is pasted, it becomes stale.
In Quadratic, this workflow is automated through direct data connections. Instead of manual entry, analysts can use SQL or Python connectors to pull external data sources directly into the grid. This allows for the integration of detailed ancillary cost projections—such as fluctuating fuel prices, hangar fees, and maintenance reserves—directly from external databases or live CSV feeds.
This connectivity ensures that the aircraft value is always based on real-time market conditions rather than last month’s data. If the market shifts or maintenance costs rise, the model updates automatically, providing a live look at the asset's worth without requiring a manual rebuild of the spreadsheet.
Step 2: Transparent logic with Python
The "black box" problem is pervasive in financial data analytics. In a traditional spreadsheet, complex depreciation formulas are often buried inside cells, looking something like =((B2-C2)/12)*D4. For a stakeholder trying to audit the model, deciphering this logic is time-consuming and prone to misinterpretation. If the logic behind an aircraft residual value assumption is not clear, the resulting valuation loses credibility.
Quadratic addresses this by allowing analysts to write valuation logic in Python directly within the spreadsheet cells. This transforms obscure formulas into readable, auditable code. Instead of a hidden string of cell references, the logic might read:
current_value = purchase_price - (monthly_depreciation * age_months)
This approach meets the critical requirement for transparency and clear formula explanations. Stakeholders, auditors, and colleagues can look at the code and immediately understand the assumptions driving the valuation. It turns the model from a black box into a glass box, where every calculation is visible and verifiable.
Step 3: Dynamic sensitivity analysis
Stakeholders rarely want just a single number; they want to understand risk. They need to know what happens to the aircraft value if fuel costs rise by 10% or if the utilization rate drops. In a standard spreadsheet, running these scenarios often involves creating data tables that are static and cumbersome to update.
Quadratic allows for the creation of a sensitivity analysis dashboard that is both dynamic and visual. Analysts can set up input cells or sliders that act as variables in the Python code. When a variable is adjusted—such as the projected inflation rate of maintenance costs—the aircraft value updates instantly across the entire model.
Furthermore, because Quadratic supports Python plotting libraries like Plotly and Matplotlib, this sensitivity analysis is not limited to a grid of numbers. Analysts can generate interactive charts that visualize depreciation curves against market volatility. This visual feedback loop allows stakeholders to see the impact of different variables in real-time, leading to faster and more informed decision-making.
Best practices for asset valuation models
Building a professional valuation model requires adherence to strict standards of auditability and presentation.
Auditability is paramount. In Quadratic, the ability to add comments directly within the Python code serves as built-in documentation. This ensures that anyone inheriting the model understands exactly why specific VREF aircraft values were chosen as benchmarks or how the depreciation curve was derived.
Precise formatting is equally important. The output section of the model should resemble a polished report, not a raw spreadsheet grid. Quadratic allows for distinct output sections where the final valuation, sensitivity graphs, and key metrics are presented clearly. This separation ensures that while the calculations are complex, the presentation to stakeholders is clean and professional.
Finally, effective models always use comparables. A robust model should automatically benchmark calculated values against standard VREF aircraft values to validate accuracy. If the internal model diverges significantly from market averages, the system can flag this discrepancy for review, adding another layer of reliability to the process.
Conclusion
Building a model for aircraft values requires more than just a calculator; it requires a data application capable of handling complexity, volatility, and scale. By moving from static cells to Quadratic’s Python-integrated environment, analysts can build models that are automated, auditable, and truly reflective of the asset's worth.
For professionals ready to move beyond the limitations of traditional spreadsheets, Quadratic offers the tools to build transparent, "glass box" valuations that stand up to scrutiny. Start building your transparent valuation model in Quadratic today.
Use Quadratic to build robust aircraft valuation models
- Build transparent valuation models: Combine spreadsheet familiarity with Python and SQL for auditable, "glass box" models that clearly show logic, not hidden formulas.
- Automate data integration: Directly connect to VREF, market data, and ancillary costs (e.g., maintenance reserves) using SQL or Python for real-time, accurate inputs.
- Ensure auditability with clear logic: Write complex depreciation and residual value calculations in readable Python code, making every assumption visible and verifiable.
- Perform dynamic sensitivity analysis: Instantly visualize how fluctuating market conditions or maintenance costs impact aircraft values using interactive dashboards and plots.
- Generate professional reports: Structure your model to separate inputs from outputs, ensuring consistent calculations and polished presentation of final valuations and key metrics.
Ready to build more accurate and auditable aircraft valuation models? Try Quadratic.