Table of contents
- Why standard spreadsheets struggle with farm inventory
- Step 1: Ingesting and standardizing naming conventions
- Step 2: Extracting critical data (days to maturity & quantity)
- Organizing the catalog: segmentation and formatting
- Building a "living" inventory system
- Practical use case: from seed bags to field planning
- Clean data = better yields
- Use Quadratic to organize and standardize farm seed data
Every season, agricultural managers and seed coordinators face the same administrative nightmare: the arrival of the seed lists. You rarely receive a clean, standardized database ready for import. Instead, you get a "Frankenstein" collection of PDFs, email bodies, and CSVs from a dozen different suppliers. One supplier lists a product as "Tomato - Early Girl (50 days)," while another lists the exact same item as "Early Girl Tomato #402."
The problem with most off-the-shelf farm inventory management software is that it expects perfect data entry. If you feed it messy, inconsistent naming conventions, your inventory counts will be fragmented, and your fragmented inventory counts and inaccurate forecasting will be off. You end up with five different entries for the same type of corn, making it impossible to get an accurate total of what you have on hand.
To solve this, many farm operators retreat to standard spreadsheets, spending hours manually deleting rows and retyping names. But there is a more efficient way. By using Quadratic—a modern spreadsheet that integrates Python directly into the grid—you can build a 'self-cleaning' inventory system. Instead of fixing rows one by one, you can create a workflow that ingests raw seed data, strips out the noise, and organizes it into a clean, readable catalog automatically.
Why standard spreadsheets struggle with farm inventory
Farmers and operators have long relied on spreadsheets as their primary farming inventory management software because of their flexibility. When you are dealing with unpredictable variables, you need a tool that can adapt on the fly. However, traditional tools like Excel and Google Sheets hit a wall when it comes to text manipulation.
Standard formulas like LEFT, RIGHT, or SEARCH are brittle. They rely on the data being in a specific position within the cell. If you try to extract "Days to Maturity" (DTM) from a product description, a standard formula might work for "Corn (90 days)" but will break completely on "90d Corn."
This is where Quadratic changes the workflow. Because Quadratic allows you to write Python directly in the spreadsheet cells, you can use advanced logic to handle "fuzzy" data. You don't need to be a software engineer to do this; simple Python scripts can identify patterns—like finding a number followed by the word "days"—regardless of where that information sits in the text string. This turns your spreadsheet from a static list into a powerful data processing tool.

Step 1: Ingesting and standardizing naming conventions
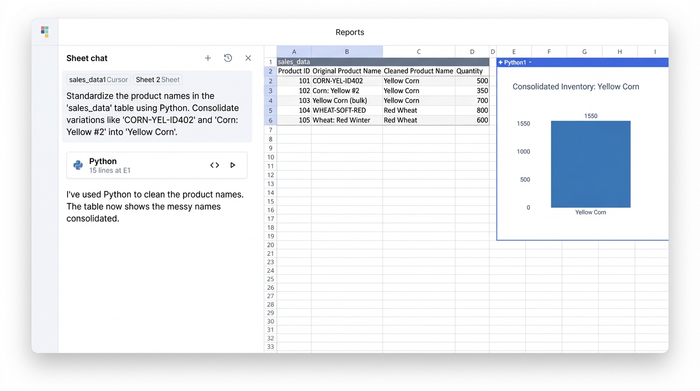
The first step in regaining control of your inventory is standardizing the product names. Your goal is to remove redundant terms, internal supplier codes, and numerical identifiers that clutter the list.
Imagine you have a raw list of grain farm inventory management software data that looks like this:
CORN-YEL-ID402Yellow Corn (bulk)Corn: Yellow #2
In a standard spreadsheet, cleaning this would require a complex nest of SUBSTITUTE and TRIM formulas, or a manual "Find and Replace" session for every single variation.
In Quadratic, you can use a Python library called distinct regular expressions (Regex) to strip out these inconsistencies in a single step. By writing a short script in one cell, you can tell the spreadsheet to "remove all patterns that look like ID numbers" and "standardize the format to Title Case."
The result is a clean list where CORN-YEL-ID402 and Corn: Yellow #2 both become "Yellow Corn." This ensures that when you pivot or sum your inventory later, these items are counted as the same product.
Step 2: Extracting critical data (days to maturity & quantity)
Once the names are clean, the next challenge is extracting the metadata hidden inside the product strings. For accurate planning, you need to isolate the "Days to Maturity" (DTM) and the package quantities into their own columns.
Using Python in Quadratic, you can split a single messy column into three distinct, usable columns: Product Name, Quantity, and DTM.
The script can look for specific patterns. For example, it can scan a cell for any number followed immediately by "d", "days", or "day" and extract that number into a "Maturity" column. It handles the variation automatically, recognizing that "50d", "50 days", and "(50 days)" all mean the same thing.
Accurate DTM tracking is essential for effective farm grain inventory management software. It allows you to move beyond simple counting and start planning harvest schedules based on when different varieties will actually be ready to leave the field.
(Visual: A screenshot displaying the transformation. A single column containing "Tomato - Early Girl (50 days) - 500 seeds" is split into three clean columns: "Early Girl Tomato," "50," and "500.")
Organizing the catalog: segmentation and formatting
Cleaning the data is only half the battle. To make the data useful for a team in the field, it needs to be organized and readable. A giant, scrolling list of 2,000 rows is difficult to navigate on a tablet or laptop.
Logic suggests that once your data is clean, it shouldn't remain in one massive list. In Quadratic, you can use queries to automatically segment your inventory. You can set up a rule that sends any item categorized as "Grain" to a specific table and "Vegetables" to another. This happens dynamically; if you change a category in the master list, it moves to the correct table instantly.
Furthermore, visual UX is critical for adoption. Unlike a database that outputs rigid reports, a Quadratic sheet allows you to adjust column widths and formatting programmatically. You can write a script that says, "If the column contains notes, make it 300 pixels wide; if it contains quantities, make it 50 pixels wide." This ensures that your inventory dashboard is always optimized for readability, saving your team from constantly resizing columns to see the data they need.
Building a "living" inventory system
The strategic differentiator of building this workflow in Quadratic is that it creates a living system, not a static report.
In a traditional workflow, if a supplier sends an updated CSV halfway through the season, you usually have to repeat your manual cleaning process—text-to-columns, find-and-replace, and re-formatting. It is tedious and prone to error.
With Quadratic, the cleaning logic is stored in the code. You simply paste the new, messy data into your designated "Input" zone. The Python scripts run automatically against the new data, and your "Clean" tables update instantly. You build the logic once, and it works forever.
This scalability is what elevates the tool from a simple spreadsheet to true farm inventory management software. It handles the repetitive data drudgery so you can focus on the actual farming operations.
Practical use case: from seed bags to field planning
When your data is clean, standardized, and segmented, it becomes a decision-making asset.
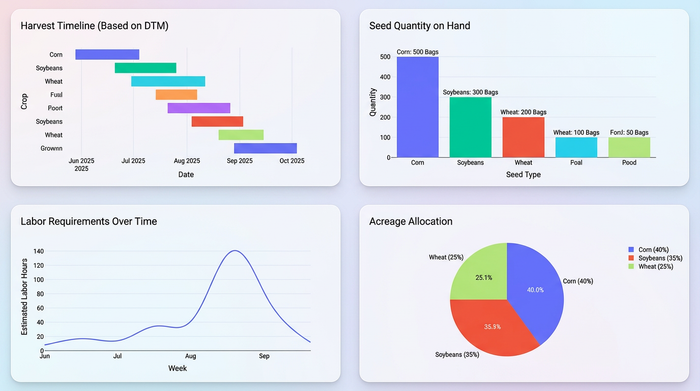
Consider the practical application of standardized DTMs. With a clean dataset, you can easily sort your inventory to see exactly which crops will hit maturity simultaneously. This allows you to forecast labor requirements weeks in advance, ensuring you have the crew available for harvest windows. You can match seed quantities on hand against acreage capacity without second-guessing if you missed a row because of a typo in the variety name.
Clean data = better yields
Inventory management is not just about counting bags in a shed; it is about data quality. When you trust your numbers, you buy more efficiently, waste less seed, and plan your seasons with greater confidence, mitigating the economic impact of poor data quality in agriculture.
Stop fighting with manual data entry and brittle formulas. By using a tool that handles the complexity of agricultural data, you can turn a chaotic list of inputs into a streamlined, automated asset.
Try Quadratic to organize your seed data and experience the flexibility required for modern farming inventory management software.
Use Quadratic to organize and standardize farm seed data
- Automate seed data cleaning: Ingest messy supplier data (PDFs, CSVs) and use Python to standardize inconsistent product names and formats in one go.
- Accurately extract key details: Reliably pull "days to maturity" and quantities from varied product descriptions, no matter how the information is phrased.
- Build a self-updating inventory: Set up cleaning logic once, then simply paste new supplier data to automatically update your entire inventory catalog.
- Dynamically organize and present data: Segment your inventory by crop type and programmatically format columns for optimal readability on any device.
- Create a living inventory system: Move beyond manual fixes to a scalable system that automatically processes new data, enabling better purchasing and harvest planning.
Ready to streamline your farm inventory? Try Quadratic.