Every social media manager knows the feeling of presenting a monthly report that looks great on the surface but lacks depth. You have a slide full of Hootsuite metrics showing impressive engagement rates, likes, and shares. Then, you have a separate slide from Google Analytics showing website sessions and conversions. The problem is the gap between them. Your stakeholders don't just want to know if a post went viral; they want to know if that viral tweet actually drove qualified leads or revenue.
This disconnect creates a "data silo" problem. Hootsuite tells you what happened on social platforms, and Google Analytics tells you what happened on your site. The challenge lies in the "messy middle"—connecting specific posts to downstream user behavior to prove ROI. Most marketers struggle to answer simple questions like, "Which specific LinkedIn post from last Tuesday drove the highest value sign-ups?" because the data lives in two different tabs. To solve this, you need to build a true cross-channel marketing report. This requires more than just looking at dashboards side-by-side; it requires a flexible data canvas like Quadratic, where you can import, clean, and blend Hootsuite and Google Analytics data to reveal the actual user journey.
Why connect Hootsuite and Google Analytics?
Integrating these two powerful data sources is about more than just saving time on manual reporting; it is about validation and survival in a data-driven marketing landscape. When you successfully connect Hootsuite and Google Analytics, you shift the conversation from activity to impact.
First, this integration allows you to move beyond vanity metrics. While likes and shares indicate brand awareness, they rarely pay the bills. By blending the data, you can trace the line from a "like" to a "session" and eventually to a "conversion." This helps you identify which channels are high-intent. You might discover that while Twitter drives high traffic volume, LinkedIn drives traffic that actually stays on the page and converts.
Ultimately, this is about justifying spend. When budget season arrives, having concrete data that proves social media activity contributes directly to the bottom line is your strongest asset. It transforms social media from a cost center into a recognized revenue driver.
The challenge: Why "black box" dashboards fall short
If the goal is blending marketing data, many marketers turn to standard reporting tools like DashThis or Whatagraph. While these tools are useful for high-level overviews, they often fall into the "widget trap." They allow you to place a Hootsuite widget next to a Google Analytics widget, visualizing the data side-by-side. However, they rarely allow you to actually merge the logic or join the datasets at a granular level.
The reality of marketing data is messy. A campaign name in Hootsuite might be tagged as summer-sale-2024, while the UTM parameter picked up by GA4 reads as Summer_Sale. In a rigid, pre-built dashboard, these two data points will never talk to each other. You cannot attribute the conversion to the post because the system doesn't understand they are part of the same campaign.
This is where the need for flexibility becomes critical. You need a tool that allows for custom data modeling—a workbench where you can fix naming conventions, normalize dates, and define your own attribution logic before visualizing the results.
Step-by-step: Building a cross-channel report in Quadratic
To truly understand your social media ROI, you need to replicate the workflow of a data analyst. Quadratic allows you to do this in a familiar spreadsheet interface that possesses the power of Python and SQL. Here is how you can build a report that connects your publishing activity to website traffic.
1. Centralize your data
The first step is bringing your disparate data sources into a single environment. In Quadratic, you can import your Hootsuite post-level metrics—such as clicks, impressions, and engagement rates—via a CSV export or by connecting directly to the API if you have that capability set up. Next, you bring in your GA4 data, specifically looking at sessions, conversions, and revenue, organized by source/medium and campaign. Having both datasets on the same infinite canvas is the prerequisite for meaningful analysis.
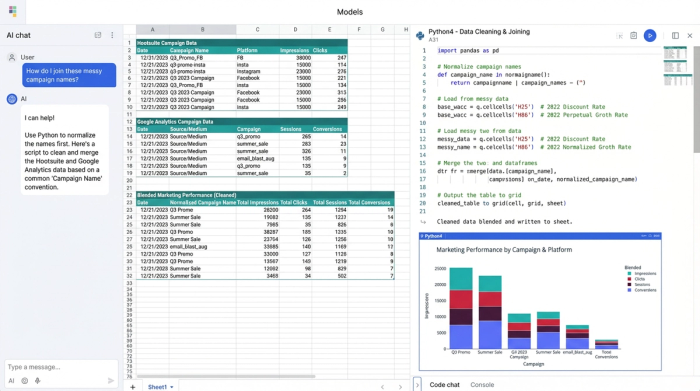
2. Clean and align your metrics
This is the step that most "black box" dashboards skip, yet it is the most important. Data is rarely clean upon arrival. You might have inconsistencies in how dates are formatted or how campaigns are named. In Quadratic, you can use built-in formulas or Python cells to clean this data instantly. For example, you can write a short script to normalize all campaign tags to lowercase or strip out accidental whitespace. This ensures that Campaign A from Hootsuite matches campaign a from Google Analytics, allowing the datasets to talk to each other.
3. Blend data for post-level attribution
Once the data is clean, you can perform the "join." This is where you map specific Hootsuite posts to GA4 sessions based on shared identifiers like Date and Campaign/UTM parameters. By blending marketing data in this way, you achieve a level of granularity that is impossible in standard tools. Instead of just seeing "Social vs. Organic," you can drill down to see "Post A vs. Post B." You can attribute a spike in web traffic on Wednesday directly to the specific content piece published on Tuesday, bridging the gap between social engagement and site behavior.
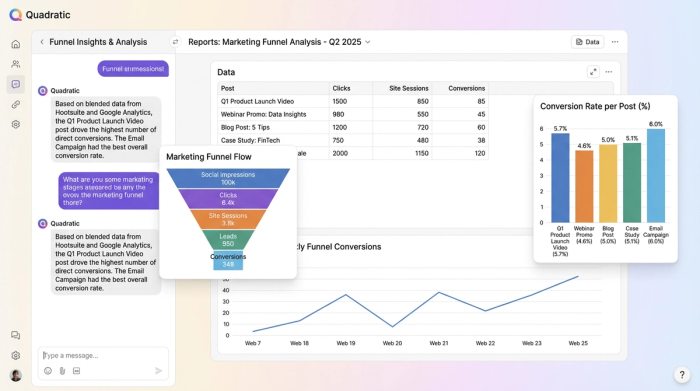
4. Visualize the ROI
With your data blended, you can now create the final view. In Quadratic, you can generate a table or chart that visualizes the full funnel: Post Content -> Clicks -> Site Sessions -> Conversions. This visual confirmation allows you to see exactly how hard your content is working. You can calculate a "Conversion Rate per Post" column, giving you a definitive metric for success that combines data from both platforms.
Analyzing the results: From likes to leads
Once you have established cross-channel reporting, the insights you gather will change how you operate. You will begin to see the difference between quantity and quality. You might find posts that had massive engagement numbers in Hootsuite resulted in high bounce rates in Google Analytics, indicating a disconnect between the ad copy and the landing page experience.
You can also optimize for timing. By correlating publishing times with high-conversion site traffic windows, you can schedule future posts when your audience is not just scrolling, but ready to buy. Most importantly, this data informs your content strategy. You can pivot your future editorial calendar based on what actually drives revenue, rather than just chasing applause.
Conclusion
Connecting Hootsuite and Google Analytics is about more than just reporting; it is about gaining strategic intelligence. When you rely on static templates or rigid dashboards, you miss the nuance of the user journey. By using a flexible data workspace like Quadratic, you can clean the messiness of real-world data and blend it to reveal the truth. Stop struggling with disconnected metrics and start building a workflow that finally proves the value of your social media efforts.
Use Quadratic to connect Hootsuite and Google Analytics for social media ROI
- Centralize social and web data: Directly import Hootsuite engagement metrics and Google Analytics 4 sessions and conversions onto a single flexible canvas, eliminating data silos.
- Clean and align messy marketing data: Use formulas or Python to normalize inconsistent campaign names, dates, and tags, ensuring accurate attribution across platforms.
- Attribute specific social posts to conversions: Join post-level data with website behavior to precisely identify which content drives leads, sign-ups, and revenue.
- Visualize the full marketing funnel: Create custom charts and tables that show the complete user journey, from social post engagement to website conversion, proving actual ROI.
- Optimize your content strategy: Gain granular insights into which social campaigns and posts truly contribute to the bottom line, enabling data-driven budget allocation and content planning.
Stop struggling with disconnected metrics and start proving your social media ROI. Try Quadratic.