
James Amoo, Community Partner
Feb 11, 2026

For growth marketers and RevOps teams, the landscape of digital measurement has become increasingly hostile. Between GDPR, CCPA, and the deprecation of third-party cookies, the signal loss anxiety is real. You are likely seeing a widening gap between what your ad platforms report and what your bank account shows.
This phenomenon, often called report mismatch, creates a chaotic environment where Google Ads might claim 50 conversions, Meta claims 40, but your CRM only shows 60 qualified leads total, making it difficult to create accurate revenue and sales data visualization. The math doesn’t add up, and the immediate instinct is often to acquire more conversion tracking tools to plug the leaks.
However, adding more software often exacerbates the problem if those tools create isolated data silos. When you have five different dashboards telling five different stories, it becomes difficult to draw accurate insights.
The solution isn't just buying better pixels or more expensive conversion tracking software. It lies in designing a resilient, layered architecture that captures data across web, product, and CRM, ensuring reliable attribution and reporting despite privacy changes.
In this blog post, we’ll explore tracking marketing metrics using conversion tracking tools and understanding the underlying architecture behind building a unified environment for tracking.
The three layers of a resilient tracking architecture
To solve the attribution crisis, teams must stop viewing tracking as a single task handled by one tool. Instead, successful SaaS companies treat conversion tracking as a stack composed of three distinct layers:
- Collection: This is how you capture the raw signal from user actions via pixels, scripts, and APIs.
- Storage & Identity: This is where data is warehoused, and anonymous user profiles are stitched together.
- Unification & Analysis: This is the brain of the operation, the layer where disparate data sources are joined, and true metrics are calculated and analyzed.
Most marketing teams over-invest in the first layer, obsessing over pixel placement, while completely ignoring the third layer. This leads to a common scenario where a company is rich in data but poor in insights, possessing terabytes of event data but lacking a unified view of how ad spend impacts revenue.
Collection tools for capturing the signal
The foundation of your stack is the collection layer. Historically, this relied almost exclusively on client-side tracking (browser pixels). Today, relying solely on the browser is dangerous due to ad blockers and privacy protections like Apple’s ITP. Modern architectures are shifting toward server-side tracking (such as Facebook CAPI or Google Enhanced Conversions) to bypass these limitations and improve data accuracy.
Different business models require specialized collection instruments. For example, standard web pixels are insufficient for mobile-first companies. You will need Mobile Measurement Partners (MMPs) to handle deep linking and attribution across app stores. Similarly, if you rely on partner networks, you need specific tools for affiliate marketers to track app conversions to ensure payouts are accurate and fraud is minimized.
Speed is also a critical factor in this layer. In high-volume acquisition campaigns, waiting 24 hours for data to settle can result in wasted budget and an increased advertising cost of sales. You need tools for real-time lead tracking and e-commerce analytics that allow you to kill underperforming ads or double down on winners immediately.
Storage and identity resolution
Once the signal is collected, it needs a central home. If your data lives inside the ad platform's walled garden, you do not own your attribution. This is where Layer 2 comes in.
This layer typically involves a cloud data warehouse or a Customer Data Platform (CDP). The primary job here is identity resolution. A user might visit your site on a mobile device (anonymous), click an ad on a desktop (anonymous), and finally sign up (known). Leading tools for tracking conversion data from campaigns excel at "stitching" these events into a single user profile.
This infrastructure ensures that you are not just counting clicks, but tracking people. It is also essential for compliance, allowing you to manage consent and data governance centrally before the data moves to the analysis stage.
The unification and analysis layer
This is the critical missing link in most marketing workflows. You have the raw clicks (Layer 1) and the user profiles (Layer 2), but you still need a flexible environment to join pre-click ad data with post-conversion billing data.
Most teams rely on the out-of-the-box dashboards provided by their tracking software. The problem is that these are rigid black boxes. They cannot model complex, business-specific metrics, such as Customer Acquisition Cost (CAC) and other relevant product metrics for specific cohort analysis. They generally track leads, but they struggle to track revenue once the sales cycle moves offline or into a complex billing system.
To understand true ROI, you need the best tools for tracking client conversion rates that allow you to audit the underlying logic. You need to be able to define what conversion is for your specific business case, whether that’s a demo request, a completed trial, or a second-month renewal. After this stage, you map your findings back to the original campaign source without relying on a rigid or pre-set attribution model. A flexible conversion tracking tool at this layer transforms raw statistics into strategic advice.
How Quadratic streamlines conversion tracking
Quadratic serves as the ideal execution of "Layer 3," providing the unification and analysis capabilities that most stacks lack. It acts as a flexible workspace that sits on top of your collection and storage tools, bringing your data together in a way that rigid dashboards cannot. Let’s explore its capabilities in detail:
Direct connection to databases
With Quadratic, you can connect directly to multiple live data sources. This includes pulling spend data from Google Ads, traffic data from GA4, and revenue data from your Postgres database or CRM, all without the pain of manual CSV exports. Quadratic also offers a familiar spreadsheet interface with native support for programming languages like Python and SQL. This allows users to write queries to join these disparate datasets precisely how you need them.
For example, you can match an ad click ID to a Stripe invoice to calculate the exact ROI of a specific campaign. This allows marketing and data teams to build transparent, auditable dashboards that update automatically, ensuring that the source of truth is always visible and verifiable.
Data analysis and visualization
After connecting your data across multiple marketing platforms, the next step is turning that data into insights through analysis and marketing data visualization that stakeholders can easily understand. Quadratic provides a unified environment that allows you to leverage LLMs for data analysis and visualize data without juggling data visualization tools.
Users can work with traditional formulas, programming languages, or take advantage of built-in AI to create dashboards by asking questions in natural language. Let’s see how this works.
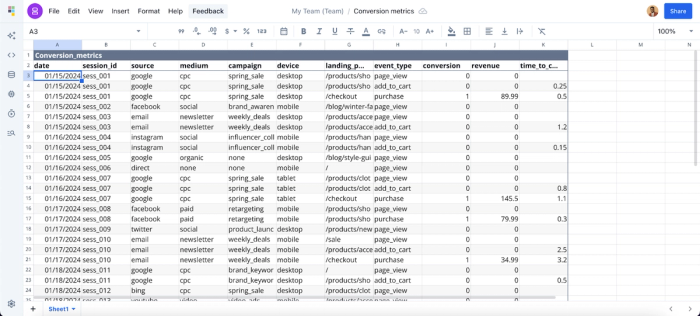
First, I import a sample marketing dataset:
Understanding which campaign channels drive the most traffic is a critical metric for marketers. With Quadratic, there’s no need to write complex formulas or SQL queries; you can simply ask questions using natural language. Here:
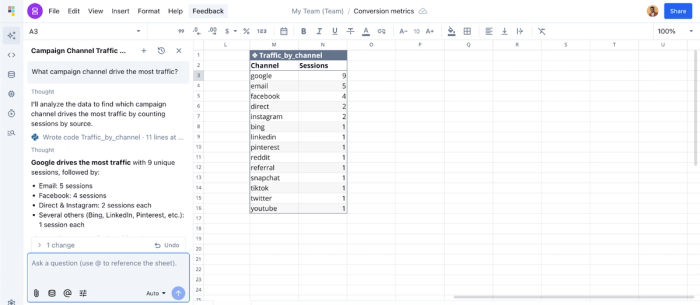
In this example, I ask Quadratic AI, “Which campaign channel drives the most traffic?” and it instantly generates a new table ranking traffic sources by channel.
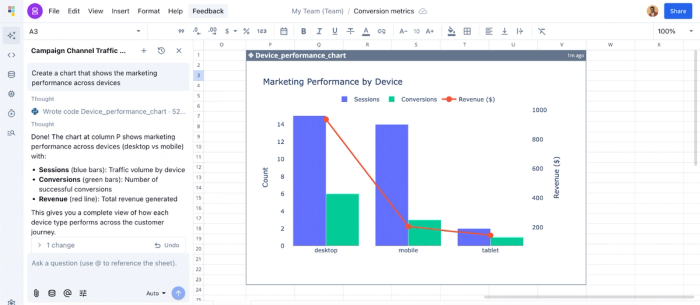
Data visualization works similarly. Simply describe how you’d like to present your data using natural language prompts, and Quadratic automatically generates the most appropriate visualization from different chart types. Let’s see it in action:
Collaboration
Marketing insights are most valuable when they can be easily shared and accessed across teams. Unlike many tools that lack built-in collaboration and require third-party workarounds, Quadratic offers a real-time collaborative analytics platform where users can analyze data and generate insights together. This removes back-and-forth friction and ensures everyone works from the same source of truth.
Conclusion
The era of relying on a single pixel to tell you everything about your business is over. Accurate measurement requires a deliberate architectural approach: robust collection, secure storage, and flexible unification.
By implementing this three-layer stack, you move beyond "good enough" attribution. You are empowered to engage in a comprehensive funnel analysis, from the first ad impression to the lifetime revenue of the customer. This isn't just about better tracking; it's about building trustworthy intelligence that gives you the confidence to scale.
By providing a unified workflow that caters to each layer, Quadratic eliminates the need for marketers to juggle between multiple conversion tracking tools, helping them focus on metrics that matter. Its built-in AI features allow marketers to spend less time analyzing raw data and focus on driving growth strategies. Try Quadratic for free today.
Frequently asked questions (FAQs)
Why are conversion tracking tools important for digital marketing?
Conversion tracking tools allow marketers to measure ROI, optimize campaigns, allocate budgets effectively, and identify high-performing traffic sources. Without accurate tracking, marketing decisions rely on assumptions rather than data.
How can unifying marketing data improve conversion tracking?
Unifying data from platforms like Google Analytics, ad networks, CRMs, and email tools creates a single source of truth. This enables faster analysis, clearer attribution, and more accurate performance reporting.
How does Quadratic streamline conversion tracking?
Quadratic connects directly to marketing platforms, APIs, and raw data sources, bringing all conversion data into one workspace. Its AI features allow users to analyze performance, generate reports, and create visualizations without complex formulas or SQL queries. This makes Quadratic one of the best conversion tracking tools.