James Amoo, Community Partner
Nov 5, 2025

Table of contents
- Understanding product success: KPIs vs metrics vs OKRs
- Financial metrics for product managers
- Product usage metrics for product managers
- Retention metrics for product managers
- Customer satisfaction metrics for product managers
- Conversion metrics for product managers
- How to efficiently keep track of your product success metrics
- Conclusion
Every product manager and business strives to build successful products, but success doesn’t just happen by chance. To truly understand whether a product is performing well, product managers must be able to answer this crucial question: “How do I measure the success of this product?”
According to research by Airtable, only 26% of product teams have high visibility into the ROI of their product launches, and just 31% feel confident they’re building the right products for their customers. These numbers highlight a significant challenge in product management today: teams are building and iterating without a clear understanding of what success looks like.
Tracking the right product management metrics is essential. The right data tells you what’s working, what isn’t, and where to focus your efforts. However, not all metrics are created equal. Measuring too many can create noise, and measuring the wrong ones can lead product teams astray.
Understanding which metrics matter and performing customer data analysis is key to making smarter product decisions and driving growth. In this post, we’ll explore the most important product management metrics every PM should know, how to measure them effectively, and how to track product metrics seamlessly using Quadratic.
Understanding product success: KPIs vs metrics vs OKRs
Many product managers often use different terms interchangeably when measuring product success. In this section, we’ll clarify three key concepts: KPIs, metrics, and OKRs. Understanding the distinction between them enables product managers to track the right data and make smarter decisions that drive product growth.
KPIs vs OKRs
OKRs stand for Objectives and Key Results. It’s a framework that helps product managers to clearly define and track goals to drive focus and growth. An objective defines what you want to achieve (e.g, “Increase customer retention rate”) while the key results specify how you’ll measure the progress toward that goal within a set timeframe
KPIs (Key Performance Indicators), on the other hand, are ongoing metrics that measure the performance of a product, team, or business over time. They show how well something is performing against set goals and typically remain consistent to ensure continuous performance tracking. In essence, the best KPI tracking measures current performance, while OKRs set direction and define what improvement should look like within a set period.
North Star metric
A North Star Metric (NSM) is the primary indicator that reflects the core value your product delivers to customers. It represents the connection between customer needs and the solution your product provides.
Unlike traditional performance metrics, a North Star Metric focuses on outcomes rather than short-term outputs. Product managers are empowered to align teams around what matters most, ensuring every feature and campaign contributes to amplifying that core customer value.
Financial metrics for product managers
Financial metrics are quantitative indicators that measure a product’s economic performance. It gives insight into how much revenue it generates, the cost it incurs, and its overall business impact.
These product-led growth metrics help product managers understand how user engagement directly affects the economic growth of the product. We’ll discuss product growth metrics such as customer acquisition cost, customer lifetime value, and average revenue per user.
Customer lifetime value (CLTV or LTV)
Customer Lifetime Value (CLTV) measures the total revenue a business can expect to earn from a customer over the entire duration of their relationship, before the customer stops using the product or cancels their subscription.
It helps companies understand the long-term financial impact of each user and how much value they bring beyond a single purchase or billing cycle. CLTV is calculated by multiplying the average customer lifetime (how long a typical customer stays subscribed) by the average revenue per user (ARPU).
For instance, if a customer spends $30 per month and stays with the product for an average of 3 years, their CLTV would be $30 × 12 months × 3 years = $1,080. This means the customer is expected to generate $1,080 in total revenue over their lifetime.
Customer acquisition cost (CAC)
Customer Acquisition Cost (CAC) refers to the average amount a company spends to acquire a new customer. It represents all expenses related to attracting and converting users, including advertising, marketing campaigns, sales efforts, and commissions. CAC is calculated by dividing the total marketing and sales costs by the number of new customers acquired within a specific period.
This metric helps product managers to assess the efficiency of their growth strategies. If the cost of acquiring a customer is higher than the revenue that customer generates (Customer Lifetime Value), the business model becomes unsustainable. By tracking CAC, product managers can identify whether their marketing and sales investments are yielding profitable returns and adjust their strategies accordingly.
Monthly recurring revenue (MRR) and Annual recurring revenue (ARR)
This metric represents the predictable income a business earns regularly from an ongoing subscription. It focuses solely on recurring revenue, excluding one-time payments, transaction fees, or other variable charges.
It helps businesses forecast financial health and assess long-term stability. Product managers can evaluate how well their subscription model is growing, identify trends in customer retention, and make informed pricing decisions.
Product usage metrics for product managers
Product usage metrics reveal how actively users engage with your product and the depth of value they derive from it. These metrics help product managers understand whether users are truly finding the product useful, how frequently they interact with it, and which features drive the most engagement. In this section, we’ll explore product adoption metrics such as session duration, daily active users (DAU) or monthly active users (MAU), and feature usage.
Daily active users/Monthly active users
Daily Active Users (DAU) and Monthly Active Users (MAU) are key product marketing metrics that measure user engagement and activity over specific time periods.
Daily Active Users (DAU) tracks the number of unique users who interact with your product on a given day. It helps product managers understand how frequently users return and engage with the product daily.
Monthly Active Users (MAU), on the other hand, measures the number of unique users who engage with your product over a 30-day period. It provides a broader view of product user metrics and long-term user retention.
Session duration
Session duration measures the average time users spend actively interacting with your product. This metric helps product managers understand user engagement depth and identify opportunities to improve usability or content relevance. For example, a short session duration may indicate that users are struggling to find what they need or losing interest quickly, while longer sessions could mean that the product successfully keeps users engaged.
Feature usage
Feature usage measures how often users interact with specific features within your product. Tracking feature adoption metrics helps product managers identify which features deliver the most value and how different user segments engage with various functionalities.
Retention metrics for product managers
Retention metrics measure how frequently customers keep coming back to use your product over time. In this section, we’ll explore product engagement metrics by comparing churn rate vs retention rate.
Customer retention rate
Customer retention rate (CRR) is a measure of the percentage of users who continue to use your product over a specific time. Here’s how to calculate retention rate:
Retention rate: (Customers at end of period - New customers / Customers at start of period)
A high retention rate indicates that users find value in your product, while a low retention rate suggests issues with user experience, onboarding, or long-term engagement. Product managers use cohort analysis to track retention rate to understand user loyalty and identify where users drop off in their journey.
Churn rate
Churn rate is the opposite of retention rate. It refers to the percentage of customers who stop using your product within a specific period. Here’s how to calculate churn rate:
Customer churn rate = Customers lost / Total customers
A high churn rate often indicates that users aren’t finding enough value to continue using a product, while a low churn rate usually reflects customer satisfaction. However, this isn’t always the case for every product. In some situations, a high churn rate can simply mean the product has successfully fulfilled its purpose. For example, when users cancel a subscription to a dating app, it might be because they’ve found a partner. In such cases, churn reflects natural completion of the user journey, not product failure.
Customer satisfaction metrics for product managers
These metrics provide valuable insight into how well your product meets user expectations and where improvements are needed. We’ll discuss metrics such as customer satisfaction score, net promoter score, and customer effort score.
Customer satisfaction score
In CSAT analytics, the Customer satisfaction score (CSAT) refers to the level of happiness or satisfaction customers experience with the features of a product. It’s often collected through surveys asking users to rate their satisfaction on a scale, for example, from 1 (very dissatisfied) to 5 (very satisfied).
Net promoter score (NPS)
The Net Promoter Score (NPS) is a metric that measures customer satisfaction by assessing how likely users are to recommend your product to others. It is also determined using a survey or simply asking customers to rate the product on a scale of 1-10. Based on their responses, customers are grouped into three categories:
- Promoters (9-10): Happy customers who actively recommend your product.
- Passives (7-8): Satisfied but neutral users who are vulnerable to competitors.
- Detractors: Unhappy customers who may discourage others from using your product.
Using an NPS calculator for tracking NPS over time helps product managers understand user sentiment and identify common pain points.
Customer effort score (CES)
Customer Effort Score (CES) measures how easy it is for users to complete a specific task or interaction within your product. It’s typically collected through surveys that ask customers to rate the level of effort required to achieve their goal or resolve an issue. A low effort score means customers can easily accomplish their goals, which correlates with higher satisfaction. A high effort score suggests friction points in the user experience that may lead to churn.
Conversion metrics for product managers
Conversion metrics measure how users move from one stage of the customer journey to the next. It provides insights into how well your overall product design motivates users to take the desired actions. These metrics, often monitored using conversion tracking tools, include conversion rate, click-through rate (CTR), and Conversion funnel drop-off rate.
Conversion rate
Conversion rate refers to the percentage of users who complete a specific action in the customer journey. This includes actions like signing up, making a purchase, or subscribing to a newsletter. Here’s how to calculate the conversion rate of your product:
Conversion Rate = Total Number of Visitors / Number of Conversions * 100
For example, if only 500 out of 10,000 visitors sign up for your product, it means your conversion rate is 5%. A high conversion rate indicates seamless onboarding and customers’ understanding of your value proposition, while a low conversion rate may suggest friction in the user journey.
Conversion drop-off rate
In funnel analysis, conversion drop-off rate accounts for the percentage of users who drop off before completing a desired action. This hints product managers of probable obstacles in the user journey or onboarding. Drop-off rate is given by:
Drop-Off Rate = Total Number of Users Who Started the Process / Number of Users Who Abandoned the Process * 100
Click-through rate
Click-through rate refers to the percentage of users who click a specific link or call-to-action out of the total number of people who saw it. It’s a metric that evaluates how effective and compelling your marketing campaigns and promotion strategies are. Click-through rate is given by:
CTR = Number of Impressions / Number of Clicks * 100
How to efficiently keep track of your product success metrics
There are countless product performance metrics to track, and we’ve only scratched the surface. Managing and analyzing all these metrics can be overwhelming, especially when you have to juggle multiple tools to find the best user analytics for product teams to achieve your desired goal. That’s where Quadratic comes in.
Quadratic is an AI tool for product managers that enables teams to build, validate, and share live analytics dashboards effortlessly. It connects directly to your databases, raw data sources, and APIs, including popular product analytics platforms like Mixpanel and Amplitude.
With Quadratic’s built-in AI assistance, product managers can simply ask questions about their data and get instant insights, thanks to its AI spreadsheet analysis technology. Beyond that, product managers can also create interactive visualizations to monitor key metrics for product management. Let’s see how we can create a live revenue chart based on sample product data by simply using text prompts:
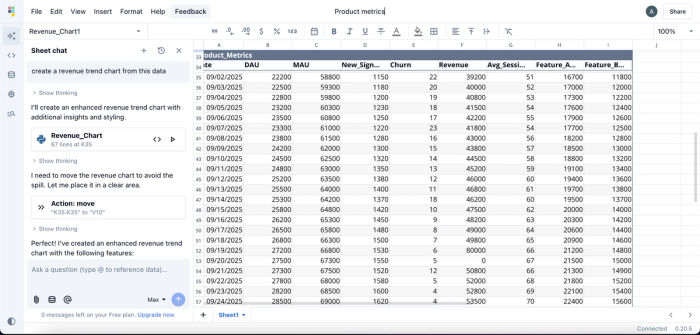
Here we prompt Quadratic AI to “Create a revenue chart from this data” and in seconds, it generates an interactive visualization:
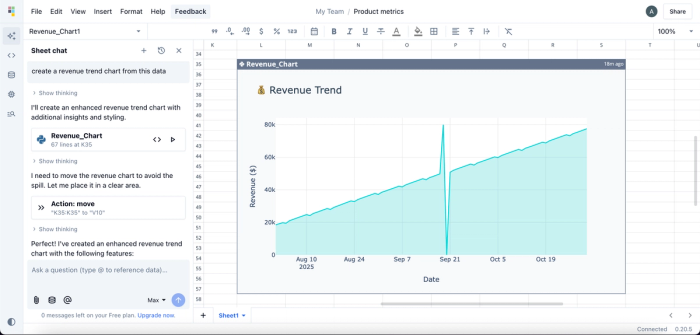
Looking at the sample product data, you’ll notice a sudden drop in value (0) at the 53rd row, which explains the corresponding dip in the generated chart. Any changes made to the dataset automatically update the chart in real time.
Using this same dataset, we can also create a chart to track Daily Active Users (DAU) or Monthly Active Users (MAU):
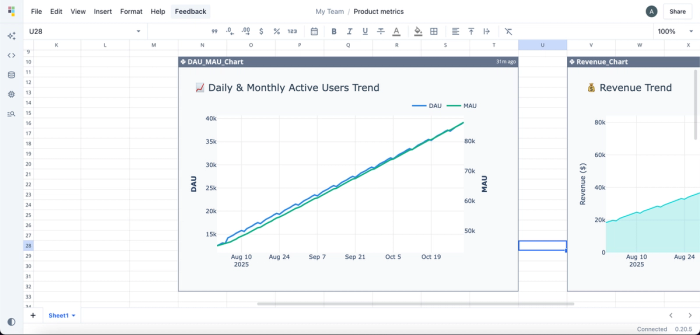
Product managers can create as many charts to visualize and track product analytics metrics on Quadratic, all by using simple text prompts.
Quadratic also comes with a variety of product management templates to track metrics such as customer retention rate, churn rate, customer acquisition cost, and more.
Conclusion
Product managers who want to drive growth must understand two key things: what product success looks like and which metrics best measure it.
In this blog post, we explored the fundamentals of product management metrics, what they are, how they differ from KPIs and OKRs, and why they matter. We also covered the important product metrics every product manager should track across revenue, customer satisfaction, product usage, retention, and conversion.
Finally, we saw how Quadratic, a product analytics software, simplifies tracking and visualization by bringing all these metrics into one environment. With Quadratic, product managers can analyze live data, gain instant insights, and visualize product performance effortlessly.