
For revenue managers and investors, effective hotel market analysis is the bedrock of a profitable strategy. However, the raw materials required to build that strategy—industry surveys, government tourism statistics, and competitor reports—are rarely ready for immediate insight. They often arrive in fragmented formats, filled with inconsistencies that make analysis difficult.
Consider a common scenario: a data analyst is tasked with evaluating monthly traveler statistics and overnight stay data to forecast trends for the upcoming fiscal year. The dataset, sourced from a regional occupancy survey, is comprehensive but messy. It contains time-series data with months spread across columns, occasional gaps where data wasn't reported, and formatting errors from OCR scanning. In a traditional spreadsheet, cleaning this data is a manual, error-prone nightmare, highlighting the need for effective data cleaning tools.
This article explores how to modernize hotel industry market analysis, including through advanced ai spreadsheet analysis, by moving beyond standard cell formulas. We will look at how using Quadratic—a spreadsheet that integrates Python natively—allows analysts, even those looking to learn python for data analysis, to programmatically clean messy survey data, handle missing values with precision, and visualize occupancy trends without leaving their familiar grid interface.
What is hotel market analysis?
At its core, hotel market analysis is the process of evaluating supply, demand, and pricing dynamics within a specific geographical area to inform operational and investment decisions. It provides the context necessary to understand whether a property is underperforming due to internal factors or broader market shifts.
Effective analysis goes deeper than tracking simple occupancy rates. It involves rigorous hotel market segmentation analysis, distinguishing between business, leisure, and group travelers to understand who is actually filling the rooms. It also examines traveler origins and length-of-stay metrics. For investors and developers, accurate data is the foundation of hotel market analysis and valuation, directly influencing decisions on asset acquisition and capital expenditure. When the data is accurate, stakeholders can confidently predict revenue per available room (RevPAR) and adjust market positioning.
The challenge: why standard spreadsheets struggle with survey data
The specific workflow of analyzing traveler statistics presents unique challenges for traditional spreadsheets like Excel or Google Sheets. The data is often structured as a time series, with rows representing different metrics (e.g., "International Arrivals," "Domestic Overnight Stays") and columns representing months over several years.
When performing hotel market data analysis on these datasets, analysts frequently encounter "blanks"—months where data is missing due to reporting lapses. In a standard spreadsheet, a blank cell breaks a formula. If you try to calculate a year-over-year variation and one month is empty, the result is an error. Furthermore, fixing these gaps often requires manual interpolation (estimating the missing number based on the surrounding months). Doing this cell by cell is tedious and risky; one copy-paste error can skew the entire market analysis for hotel business plan projections.
Step-by-step: analyzing occupancy trends with Python in Quadratic
Quadratic, recognized as one of the best data science tools, solves these issues by combining the visual interface of a spreadsheet with the data cleaning power of Python. This allows analysts to treat their sheet like a powerful data workspace. Here is how a user can transform raw, messy survey data into actionable insights.
1. Importing and structuring the data
The process begins by bringing the raw survey data into Quadratic. Because Quadratic supports standard CSV and Excel imports as well as direct database connections, which often leverage both python and sql, the analyst can load the traveler counts and variation metrics directly into the grid. Unlike a standard sheet where data is static, the data in Quadratic can be referenced as a DataFrame (a structured table used in Python). This allows the analyst to manipulate thousands of rows of monthly statistics instantly without dragging formulas down thousands of cells.
2. Cleaning the data (handling blanks & errors)
This is the most critical step in the workflow. Raw government statistics often contain non-numeric characters (like "N/A" or footnotes) and missing months. In Excel, an analyst might manually delete these or try to write complex IFERROR nested formulas.
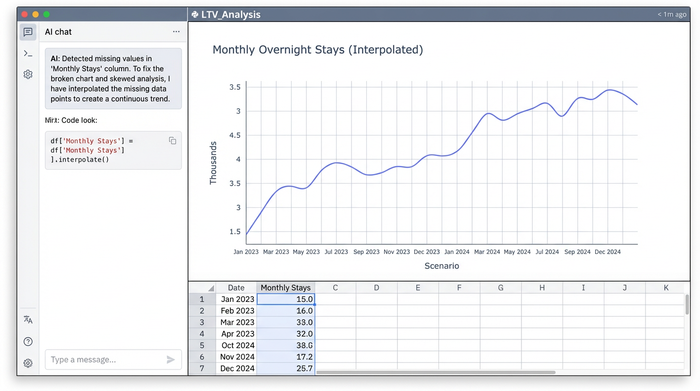
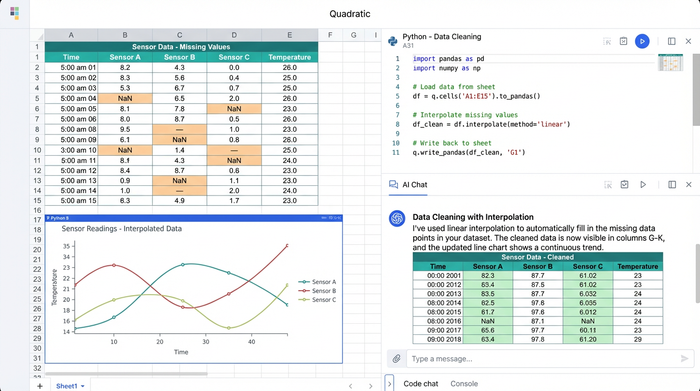
In Quadratic, the analyst can write a short Python script using the Pandas library directly in the sheet. For example, to handle missing data points, the analyst can use linear interpolation. By writing a simple command, the script looks at the months before and after a blank cell and mathematically calculates the most probable value to fill the gap. This ensures the dataset is complete without human guesswork. If the survey source updates, the script runs again automatically, instantly cleaning the new data.
3. Calculating year-over-year variations
Once the data is clean, the next step in hotel market trends analysis is calculating variations. The analyst needs to see the percentage change in overnight stays compared to the same month in the previous year.
Instead of writing a formula in cell C2 and dragging it to cell C1000, the analyst uses Python vectorization. This method calculates the variation for the entire column in a single step. The script subtracts the previous year's column from the current year's column and divides by the previous year, handling the math for every row simultaneously. This reduces the file size and eliminates the risk of "broken links" or formula inconsistencies that plague complex financial models.
4. Visualizing the trends
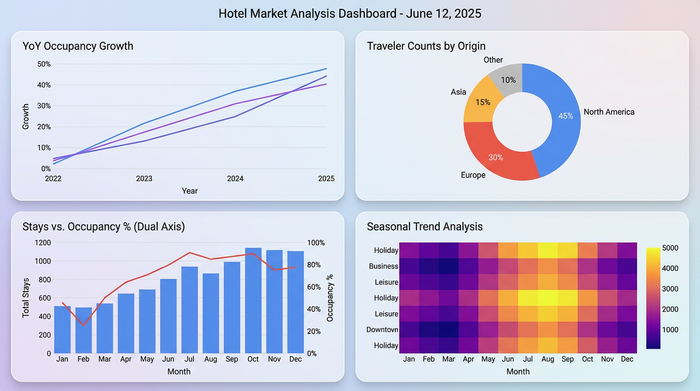
With a clean, complete dataset, the analyst can now visualize the results, potentially building a python dashboard for ongoing monitoring. Quadratic allows users to generate charts using Python libraries or built-in plotting tools. The analyst can overlay traveler counts against occupancy percentages on a dual-axis chart to spot seasonal trends. Because the "blanks" were programmatically filled in step 2, the trend lines are smooth and continuous, providing a clear picture of the market's trajectory.
Applied example: NYC hotel market analysis
To see this in practice, consider a revenue manager performing an NYC hotel market analysis. New York is a high-volume, highly competitive market where small shifts in traveler demographics can dictate pricing strategy.
The manager imports a dataset showing a sudden dip in "International Arrivals" for February. Using the cleaning workflow described above, they normalize the data to account for a leap year variation that skewed the raw numbers. With clean data, they perform a granular hotel marketing analysis and realize that while international travel dropped, domestic business travel surged by 12%. This insight, hidden under messy raw data, allows the marketing team to pivot their ad spend toward domestic business hubs immediately, capturing revenue that competitors relying on uncleaned data might miss.
Conclusion
In the hospitality industry, data is abundant, but clean, actionable data is scarce. Relying on manual spreadsheet methods to clean complex time-series data creates bottlenecks and introduces risk into the decision-making process.
Quadratic empowers analysts to bridge the gap between raw statistics and strategic insight. By integrating Python directly into the spreadsheet, users can automate the tedious "messy middle" of data analysis—filling blanks, correcting errors, and calculating variations—ensuring that their revenue strategies are built on a foundation of accuracy. For analysts ready to stop wrestling with broken formulas and start uncovering real trends, importing your dataset into Quadratic is the first step toward clearer business intelligence.
Use Quadratic to do hotel market analysis
- Programmatically clean messy hotel survey data, including traveler statistics and occupancy rates, directly within the spreadsheet using Python.
- Automate the handling of missing values (blanks, errors) with advanced interpolation techniques, ensuring complete and accurate time-series data.
- Effortlessly calculate year-over-year variations and other complex metrics across large datasets using Python vectorization, eliminating manual formula errors.
- Visualize smooth, continuous occupancy and traveler trends from cleaned data, providing clear, actionable insights for revenue management and investment decisions.
- Streamline your entire hotel market analysis workflow, from raw data import to dynamic visualizations, allowing for faster adaptation to market changes.
Ready to transform your hotel market analysis? Try Quadratic.