
Operational research is rarely straightforward. Whether you are managing complex resource allocation, fine-tuning a supply chain schedule, or handling mix optimization, finding the truly "optimal" solution requires rigorous mathematics. For years, analysts and engineers have relied on optimization techniques to maximize efficiency and minimize costs. However, the tools used to solve these problems often introduce friction into the workflow.
Standard spreadsheet solvers are accessible but function as "black boxes." They hide the solving logic behind dialog menus, require manual re-runs every time a variable changes, and struggle to scale. Conversely, writing optimization scripts in a Python IDE offers power and transparency, but it strips away the visual context of the data, making it difficult to spot data entry errors or visualize the final schedule.
There is a better way to approach these problems. By using a hybrid workflow that combines the visual interface of a spreadsheet with the raw power of Python, analysts can define, solve, and validate integer linear programming models in a single environment. This article explores how to bridge the gap between data and logic using Quadratic.
What is integer linear programming?
To understand how to improve the workflow, it is helpful to first clarify the terminology. At its core, linear programming is a method used to achieve the best outcome—such as maximum profit or lowest cost—in a mathematical model whose requirements are represented by linear relationships.
The specific subset known as integer linear programming (ILP) adds a critical constraint: some or all of the variables in the solution must be integers, or whole numbers. This distinction is vital for real-world operations.
- Linear Programming (LP): Deals with continuous variables. For example, if you are optimizing a recipe, the solution might tell you to use 1.5 liters of water. This is perfectly acceptable.
- Integer Programming (IP): Deals with discrete items. If you are optimizing a shipping fleet, a solution suggesting you dispatch "3.5 trucks" is impossible. You must dispatch either 3 or 4.
In many business cases, you will encounter mixed integer linear programming (MILP). This involves problems where some variables are constrained to be integers (e.g., number of machines running) while others remain continuous (e.g., electricity consumed). Understanding what is integer linear programming and how it differs from standard linear models is the first step toward building accurate operational models.
The challenge: spreadsheets vs. code
For decades, operational researchers have been forced to choose between two imperfect environments: the rigid spreadsheet or the abstract code editor.
Legacy spreadsheet tools utilize "Solver" add-ins. While these allow users to keep their data in a grid, the optimization logic is often brittle. The constraints are buried in pop-up menus, making the model difficult to audit. Furthermore, these solvers often require a manual trigger; if you update a cost variable, the optimal solution does not update until you remember to click "Solve" again.
On the other hand, engineers who switch to Python or R gain access to powerful open-source libraries like PuLP or scipy. These libraries handle linear and integer programming with ease and transparency. However, a Python script lacks a native data grid. Entering the cost matrix or capacity constraints involves typing arrays manually into code or managing external CSV files, which separates the data from the logic.
Quadratic removes this trade-off. It provides a modern spreadsheet interface where you can enter data visually, but it allows you to use Python directly in the cells to handle the optimization logic. This creates a bridge where linear programming integer programming models become both visual and auditable.
Tutorial: building a resource allocation model
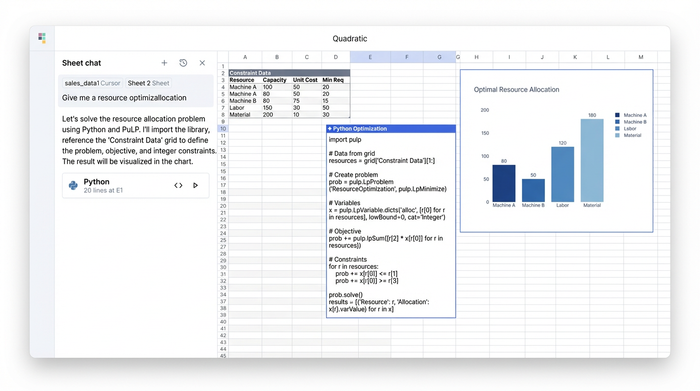
To demonstrate the power of this hybrid approach, let’s look at a common scenario: a resource allocation problem where a factory must decide how many units of different products to produce to maximize profit, subject to limited machine hours and labor.
1. Structuring data and constraints
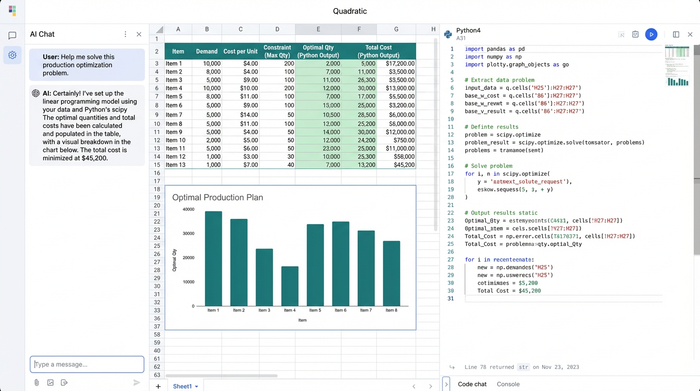
In a standard Python script, you would define your costs and constraints as variables or lists within the code. In Quadratic, you define them in the spreadsheet grid. You can create a table with columns for "Product Type," "Profit per Unit," "Machine Hours Required," and "Labor Hours Required."
This visual setup offers a distinct advantage. If a manager decides to change the profit margin on a specific product, you simply edit the cell in the grid. You do not need to parse through lines of code to find the input variable. The data remains human-readable and easily editable by anyone on the team, regardless of their coding ability.
2. Solving with Python (MILP integration)
Once the data is structured, you move to the solving phase. Instead of opening a "Solver" dialog box, you click a cell in Quadratic and switch it to Python mode. Here, you can import standard optimization libraries like PuLP.
You can reference the data grid directly as a DataFrame. The code pulls in the costs and constraints you defined in step one. You then write the optimization logic explicitly. You define the decision variables (e.g., number of units to produce) and set the objective function (maximize total profit). Because you are writing code, you can easily specify that these variables must be integers, effectively creating an integer linear program.
The logic is now transparent. Any analyst reviewing your work can look at the code cell and see exactly how the constraints are applied. There are no hidden parameters.
3. Validating solutions and preventing overlap
In operational research, validation is critical. You need to ensure the solution is feasible in the real world. A common issue in scheduling or allocation is overlap—assigning two jobs to the same machine at the same time or over-allocating a resource due to a data entry error.
In this workflow, you can chain Python cells together. Once the optimization cell runs and outputs the optimal mix, a downstream Python cell can automatically ingest that solution to perform validation checks. You can write logic that specifically looks for overlapping schedules or resource violations.
If the model produces a result where a machine is double-booked, your validation script can flag it immediately in the spreadsheet. This loop—define, solve, validate—ensures that the final output is not just mathematically optimal, but operationally sound.
Advantages of a code-enabled spreadsheet
Moving your milp mixed integer linear programming workflows into a tool like Quadratic offers benefits that go beyond simple convenience.
Dynamic scenarios
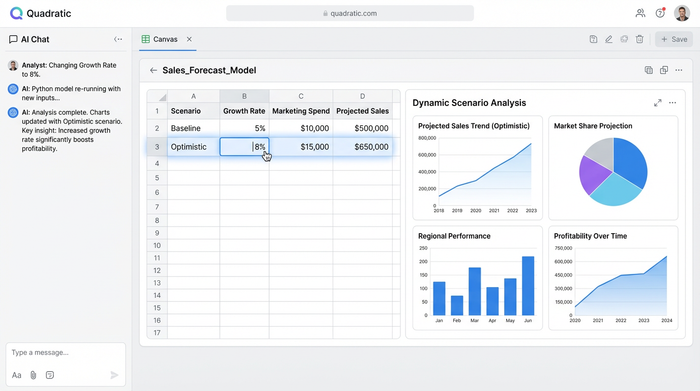
In legacy tools, "what-if" analysis is tedious. You change a cell, open the solver, run it, and wait. In Quadratic, the relationship between data and code is dynamic. If you change the available labor hours in the grid, the Python cell containing your optimization model automatically re-calculates. The solution updates instantly, allowing for rapid scenario planning.
Transparency and auditability
Black box solvers are a liability in complex business engineering. By writing the linear and integer programming logic in Python, you create a self-documenting model. The code serves as the record of how the answer was derived. This makes peer review significantly easier and builds trust in the results.
Scalability
Standard spreadsheet solvers often hit a ceiling with the number of variables or constraints they can handle before crashing or timing out. By leveraging Python libraries within the spreadsheet, you can handle significantly larger datasets and more complex linear integer programming models without leaving the interface.
Conclusion
Integer linear programming is a fundamental tool for making data-driven business decisions. However, the friction caused by legacy tools has long forced analysts to choose between the visibility of a spreadsheet and the power of code.
By adopting a platform that integrates Python directly into the grid, you no longer have to compromise. You can build models that are visual, dynamic, and rigorously validated. Whether you are solving a simple mix optimization or a complex scheduling problem, the ability to see your data and audit your logic simultaneously leads to better outcomes.
If you are ready to move beyond black-box solvers and static scripts, try solving your next optimization challenge in Quadratic. It allows you to focus on the mathematics and the results, rather than fighting with the tools.
Use Quadratic to solve and validate integer linear programming models
- Define ILP models visually: Structure data like profit margins, machine hours, and labor constraints directly in a familiar spreadsheet grid, making it human-readable and easily editable for anyone on your team.
- Solve with transparent Python logic: Integrate powerful libraries like
PuLPdirectly in cells to write explicit optimization logic, including integer constraints, ensuring full auditability and eliminating "black box" solvers. - Validate solutions in the same environment: Chain Python cells to automatically check for real-world feasibility, such as resource overlaps or violations, flagging issues directly in the grid for immediate correction.
- Run dynamic "what-if" scenarios instantly: Modify input data in the grid and see your integer linear programming solutions re-calculate automatically, enabling rapid scenario planning without manual re-runs.
- Scale complex optimization problems: Leverage Python's capabilities within the spreadsheet to handle larger datasets and more intricate integer linear programming models than traditional spreadsheet solvers.
Ready to build more transparent and dynamic optimization models? Try Quadratic.