
For finance teams and data analysts, the end of the month often brings a familiar headache: the arrival of dozens, if not hundreds, of PDF invoices. While these documents are technically digital, they are rarely usable in their raw format. To a standard spreadsheet, a PDF is essentially a locked image. The data—dates, line items, service hours, and totals—is trapped inside, forcing analysts into a bottleneck of manual data entry.
This disconnect creates a significant drag on productivity, contributing to the high cost of manual invoice processing. Manual entry is slow, unscalable, and prone to human error. To solve this, many teams turn to invoice data capture software. However, the current market options often force a difficult compromise. Legacy OCR (Optical Character Recognition) tools are notoriously rigid, breaking whenever a vendor changes their invoice layout. On the other hand, modern "black box" SaaS platforms offer automated data processing, but they are often expensive and opaque; if the software misreads a 7 for a 1, you have no way to audit the logic behind the error.
For technical finance professionals who know their way around Excel and perhaps dabble in Python, there is a third option. Quadratic offers a transparent middle ground. By acting as a Python-powered spreadsheet, it allows you to build your own invoice scanning and data capture pipeline directly within a familiar grid interface. You get the flexibility of code to handle complex layouts and redactions, combined with the visibility of a spreadsheet to verify every single digit.
Why finance pros need "transparent" data capture
When you rely on external SaaS tools to capture invoice data, you are often relying on a proprietary algorithm you cannot see or tweak. For high-stakes financial reporting, such as the processing of OCR financial statements, 'trust us, it works' is rarely a sufficient audit trail. Finance professionals need transparency and the ability to handle the nuances of real-world documentation.
One of the biggest challenges in this workflow is semi-structured data, where information does not conform to a fixed data model but contains tags or other markers to separate semantic elements. Invoices are not uniform; one vendor might list the "Total Due" at the bottom right, while another places it at the top left. Rigid templates fail here. However, by using Python libraries within Quadratic, you can write flexible logic that searches for keywords rather than fixed coordinates, ensuring your process remains robust even when layouts shift.
Furthermore, off-the-shelf AI invoice data capture tools often lack the ability to apply custom logic during the extraction phase. A prime example is redaction. A finance team might need to extract billing data for internal analysis but is legally required to redact sensitive client names or PII (Personally Identifiable Information) redaction before that data enters a wider reporting system. Standard software typically extracts everything or nothing. In a programmable environment, you can define specific rules—such as "extract the dollar amount, but replace the client name with [REDACTED]"—giving you granular control over data privacy.
Finally, there is the issue of auditability. When you script your extraction logic inside a cell, the process is self-documenting. Any reviewer can click the cell to see exactly how the raw PDF text was transformed into a structured number. This eliminates the "black box" risk and ensures that your financial data is always traceable to its source.
Step-by-step: Building an invoice extraction pipeline in Quadratic
Building a custom extraction workflow might sound complex, but in a Python-enabled spreadsheet, it follows a logical, linear path. Here is how a finance analyst can build a repeatable pipeline to handle invoice data capturing, complete with custom redaction rules.
1. Ingesting the PDF data
The first step is bringing the raw documents into your environment. In a standard spreadsheet, you cannot simply reference a PDF file. In Quadratic, you can upload your invoice files directly to the spreadsheet’s file system.
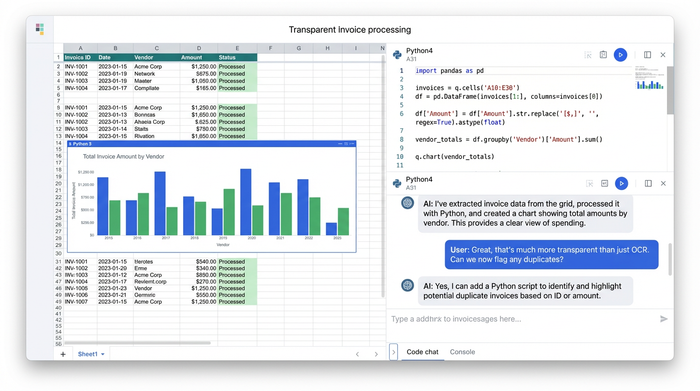
Once the files are available, you use Python to read them. Instead of manual transcription, you utilize open-source libraries like PyPDF2 or pdfplumber. These libraries are designed to capture data from invoices cloud environments or local uploads by reading the text layer of the PDF. With a few lines of code, the content of the invoice is pulled into the spreadsheet as raw text, ready for parsing.
2. Extracting structured fields
With the raw text loaded into a variable, the next step is to isolate the specific data points you need, such as invoice dates, service descriptions, hours billed, and total amounts.
This is where Python’s strength in text processing comes into play. You can write a function that looks for specific markers. For example, you can tell the script to find the phrase "Total Hours:" and capture the number immediately following it. Using Regular Expressions (Regex), you can create flexible patterns that identify dates (looking for formats like MM/DD/YYYY) or currency values, regardless of where they sit on the page. The result is a set of structured values that populates your spreadsheet cells automatically.
3. Applying custom logic: redaction and formatting
This stage is where a custom workflow outperforms generic invoice data capture software. Let’s say you are processing client billing that contains sensitive client names. You need the billing hours and amounts for your revenue analysis, but you cannot expose the client identities to the broader team.
In your Python script, you can add a conditional rule. You might instruct the code to check the "Description" field against a list of sensitive clients. If a match is found, the script extracts the financial data but replaces the client name string with a placeholder like "[REDACTED]" or "[CONFIDENTIAL]." This ensures that the dataset is clean, compliant, and ready for distribution the moment it is generated, saving you from having to manually censor rows later.
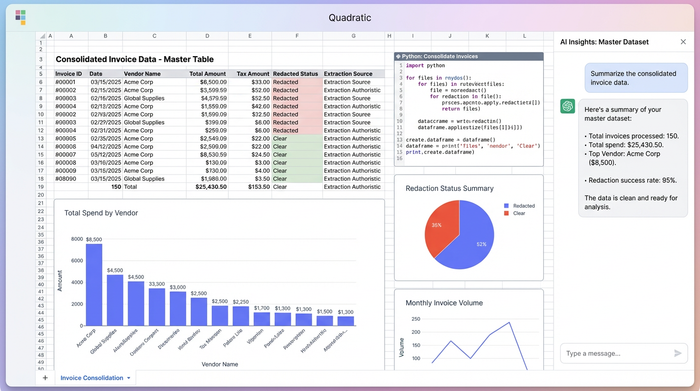
4. Consolidating the dataset
Extracting data from one invoice is helpful, but the real power lies in automation. Once your logic is working for a single file, you can wrap that logic in a loop.
You can instruct Quadratic to iterate through every PDF in your uploaded folder, applying the same extraction and redaction rules to each one. The script then compiles these individual records into a single master table—a pandas DataFrame—that is displayed directly in the sheet. You go from a folder full of disjointed PDFs to a single, consolidated dataset of billing entries and summaries in seconds.
Beyond extraction: Validating and exporting your data
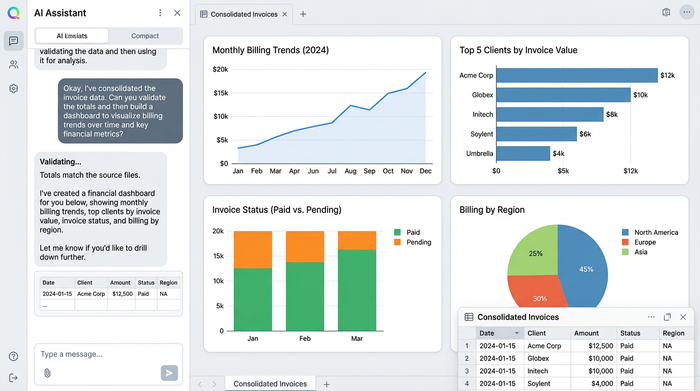
Once the invoice data capture process is finished, the data sits in a familiar grid structure. This allows you to immediately validate the results. Because Quadratic supports SQL, you can query your newly created dataset just as you would a database. You might run a query to flag any invoices where the extracted amount exceeds a certain threshold or where the date falls outside the expected fiscal period. This allows for rapid exception handling before the data ever leaves the tool.
After validation, the clean, consolidated data is ready for downstream use. You can export the master table as a CSV or JSON file for easy import into an ERP system, or you can build charts and dashboards directly within Quadratic to visualize billing trends over time.
The future of financial workflows
For too long, finance teams have been stuck choosing between the drudgery of manual typing and the rigidity of expensive enterprise software. Automated invoice data capture should not require a massive budget or a sacrifice of control.
By utilizing a tool like Quadratic, analysts can leverage the power of code to handle complex tasks—like looping through files and applying custom redaction logic—without losing the intuitive, visual nature of a spreadsheet. It transforms the invoice processing workflow from a black box into a transparent, auditable, and highly efficient pipeline. If you are ready to stop typing and start analyzing, try extracting your first PDF invoice in Quadratic today.
Use Quadratic to do invoice data capture
- Automate the extraction of dates, line items, and totals from PDF invoices directly within a Python-powered spreadsheet.
- Build flexible extraction logic using Python to handle semi-structured data and adapt to varying invoice layouts without breaking your process.
- Gain full transparency by seeing and auditing every step of your data capture logic, eliminating "black box" risks in financial reporting.
- Apply custom rules, such as redacting sensitive client information or PII, directly during the extraction process for enhanced data privacy and compliance.
- Consolidate data from dozens or hundreds of PDF invoices into a single, clean, and structured dataset, ready for validation and export to other systems.
Ready to streamline your invoice processing? Try Quadratic.