
Table of contents
- The challenge: Why raw extraction isn't enough
- The Quadratic approach: Extraction meets code
- 1. Ingesting and structuring the data
- 2. Programmatic formatting (The "secret sauce")
- 3. Validation and analysis
- Why "code + spreadsheet" is the future of financial reporting
- Conclusion
- Use Quadratic to OCR financial statements
For financial analysts and accountants, the "PDF prison" is a familiar place. You receive a crucial balance sheet or income statement, but it is locked inside a scanned image or a flat PDF. To analyze the data, you are forced to spend hours manually cleaning data, with some estimates suggesting data professionals spend up to 60% of their time on such tasks, or fixing broken formatting from a copy-paste job. While there are many tools designed to handle ocr financial statements, most of them only solve half the problem.
The typical optical character recognition (OCR) workflow extracts text but destroys context, highlighting common challenges in financial data extraction from unstructured sources. It dumps raw, unformatted data into a CSV file, stripping away the bold headers, indentations, and hierarchies that make financial reports readable. This leaves you with a "digitized" mess that requires significant manual cleanup before you can even begin your analysis.
To truly automate financial reporting, leveraging the many benefits of automating financial reports, you need a workflow that handles both extraction and presentation. By using Quadratic—where Python runs directly inside the data science spreadsheet grid—you can move beyond simple text recognition. You can implement programmatic formatting, transforming unstructured scans into board-ready, fully formatted reports in a single step.
The challenge: Why raw extraction isn't enough
Financial data is defined by its structure, with a clear hierarchy of financial data being crucial for effective analysis. A balance sheet isn't just a list of numbers; it is a hierarchy of categories, subtotals, and year-over-year comparisons. When you use standard tools for OCR financial statements, that hierarchy is often lost.
Most OCR software treats a financial document like a block of text. It might successfully identify that the number "1,000,000" sits next to the words "Total Assets," but it typically exports this as two adjacent cells in a flat CSV file. It fails to capture that "Total Assets" should be bolded, that it is the sum of the rows above it, or that it belongs to a specific reporting period.
This creates a "two-step disconnect." First, you run the extraction tool. Second, you open Excel and spend hours reconstructing the visual logic of the report—merging cells, adding borders, and verifying that the numbers actually add up. For data engineers and analysts, this manual reconstruction is the bottleneck. To modernize this workflow, the goal must shift from simply digitizing financial data to programmatically reconstructing the report for immediate strategic analysis.
The Quadratic approach: Extraction meets code
Quadratic bridges this gap by combining the familiarity of a coding spreadsheet with the power of Python. Unlike traditional spreadsheets where you are limited to formulas, or standalone Python scripts that lack a visual interface, Quadratic allows you to write code that interacts directly with the grid.
In this workflow, you ingest the unstructured source—such as a PDF or image file—directly into the environment. You can then use Python libraries or integrated Large Language Models (LLMs) to parse that text. However, instead of stopping at a raw export, you use Python to map that data into a structured format, such as a pandas DataFrame, right within the sheet.
This approach offers transparency. In many SaaS OCR platforms, the extraction logic is a "black box" you cannot see or modify. In Quadratic, the code is visible next to your data. If the extraction misses a row or misinterprets a column, you can tweak the Python script instantly to correct it, making it an excellent environment to learn Python for data analysis.
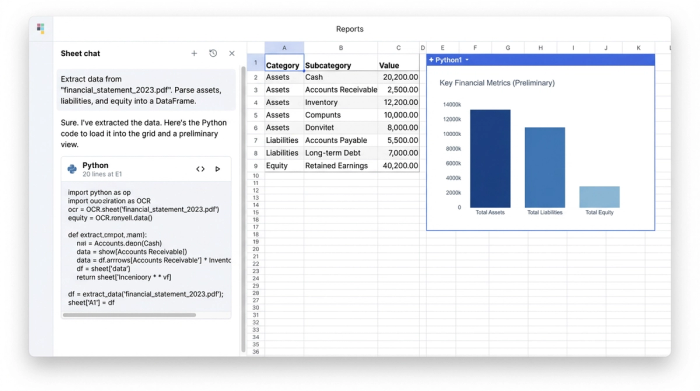
1. Ingesting and structuring the data
The first step in transforming a scanned document is pulling the raw metrics. Using Python within Quadratic, you can connect to an AI model, one of the many powerful ai tools for finance, or an OCR library to read the document. The script identifies key financial health indicators, such as assets, liabilities, and equity, along with their corresponding values across multiple reporting periods.
Rather than manually typing these into cells, the Python script organizes the unstructured text into a clean table. It aligns the reporting periods (e.g., Q1, Q2, Q3) as columns and lists the line items as rows. This creates a structured dataset where every number is associated with its correct category and timeframe, serving as the foundation for the formatting layer.
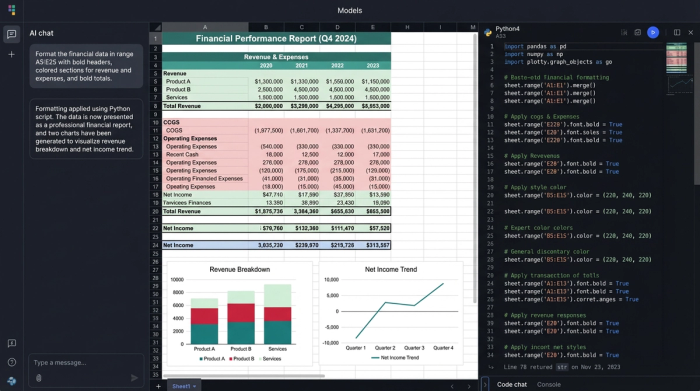
2. Programmatic formatting (The "secret sauce")
This is where the workflow differentiates itself from standard automated financial data extraction. Once the data is in the grid, you don't have to manually beautify it. You can script the style just as you scripted the data extraction.
In the user case that inspired this workflow, the analyst used Python to apply specific visual rules automatically:
- Merged labels: The script identifies category headers and automatically merges cells to span the appropriate columns, ensuring the layout matches the original report's hierarchy.
- Visual hierarchy: The code detects key summary lines, such as "Total Assets" or "Total Equity," and applies bold formatting to those headers. This makes the report scannable immediately upon generation.
- Color coding: To make the spreadsheet easier to audit, the script applies distinct background colors. It might color-code input cells differently from calculated totals, helping users distinguish between raw data and derived metrics.
- Borders and sizing: Finally, the script auto-sizes columns to fit the content and applies borders to separate different sections of the financial statement.
The result is a polished, professional spreadsheet that looks like it was formatted by hand, but was actually generated in seconds, allowing you to create a dashboard in python for immediate insights.
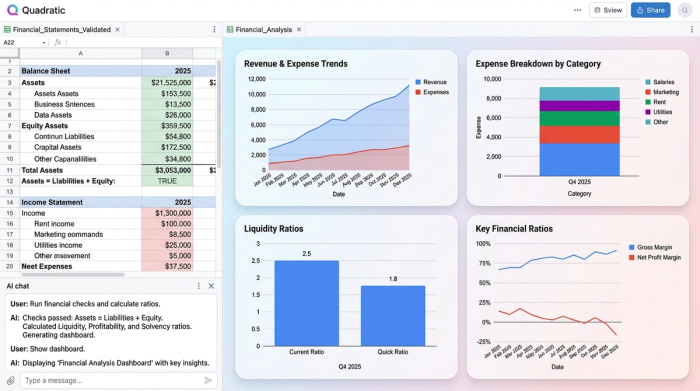
3. Validation and analysis
With the data structured and formatted, the final step is validation. Because the data is now in a live spreadsheet environment, you can immediately run checks to ensure accuracy. For example, you can write a simple formula or Python assertion to verify that Assets equal Liabilities plus Equity.
Once validated, the data is ready for deep financial data analytics. You can proceed directly to calculating liquidity ratios, forecasting future performance, or visualizing trends without ever leaving the spreadsheet. There is no need to export to a different tool or clean up the data further.
Why "code + spreadsheet" is the future of financial reporting
The true power of this approach lies in reproducibility. Financial statements are recursive; you receive them every month or quarter. If you rely on manual formatting, you are doomed to repeat the same "copy-paste-fix" cycle indefinitely.
By building a workflow in Quadratic, you create a reusable engine. When next month's statement arrives, you simply feed the new PDF into the existing script. The extraction runs, the data populates, and the programmatic formatting applies the bolding, borders, and colors automatically.
This method also provides the flexibility to handle edge cases. If a new line item appears in a statement that breaks a standard OCR template, a Python-based workflow allows you to adjust the logic to accommodate the change without starting over. It transforms the task of ocr financial statements from a manual chore into a scalable engineering process, exemplifying automated data processing.
Conclusion
True automation in finance requires more than just getting the numbers out of a PDF, a challenge best met with robust data automation software. It requires presenting those numbers in a way that is immediately useful for decision-making. Standard tools often leave analysts with the burden of formatting and cleanup, negating the time saved by extraction.
By combining Python for extraction with a spreadsheet for presentation, you can bridge the gap between unstructured data and structured analysis. Stop manually formatting your exports and start building reproducible workflows that turn raw scans into board-ready reports instantly.
Use Quadratic to OCR financial statements
- Transform scanned financial statements into fully formatted, analysis-ready reports in a single step, combining data extraction and presentation.
- Automate the application of visual hierarchy, including bolding key headers, merging cells, and applying borders, eliminating hours of manual cleanup.
- Build reproducible workflows that automatically process recurring financial statements, applying consistent extraction and formatting without manual intervention.
- Gain transparency and control over extraction logic with visible Python code, allowing instant adjustments for missed rows or misinterpreted data.
- Perform immediate validation and deep financial analysis directly within the formatted spreadsheet environment, streamlining your workflow from ingestion to insights.
Stop manually formatting your exports. See how easy it is to automate your financial reporting with Try Quadratic.