
Table of contents
- The growing complexity of financial reconciliation
- The landscape: spreadsheets vs. "black box" automation
- Step-by-step: building a transparent reconciliation workflow
- Handling exceptions: the key to audit readiness
- Best practices for automated reconciliation tools
- Conclusion: the future of payment operations
- Use Quadratic to do transaction reconciliation
In the high-stakes world of financial operations, the numbers simply have to match. When internal transaction logs don’t align with bank statements or payment processor reports, it is more than just an annoyance for the finance team; it is a genuine compliance risk. For payment operations specialists and financial analysts, who often engage in financial data analytics, transaction reconciliation—the process of comparing two sets of records to ensure figures are correct and in agreement—is the bedrock of financial integrity.
However, the modern "Payment Ops" landscape has made this fundamental task increasingly difficult. Transaction volumes are exploding, often exceeding the row limits of traditional spreadsheets. Analysts are left trying to force massive CSV exports into files that crash upon opening, or worse, relying on a fragile web of manual VLOOKUPs that break the moment a column is shifted. True audit readiness requires moving beyond these manual cell-checking methods toward automated, reproducible workflows. Crucially, you do not necessarily need to purchase expensive, rigid enterprise resource planning (ERP) software to achieve this. By utilizing a coding spreadsheet like Quadratic, teams can build transparent, auditable reconciliation systems that combine the flexibility of a spreadsheet with the power of Python.
The growing complexity of financial reconciliation
Reconciling finances is no longer as simple as balancing a checkbook. Modern financial operators are tasked with handling complex datasets populated with merchant identifiers, varying timestamp formats, status codes, and multi-currency values. This complexity applies across the board, from corporate card transaction reconciliation, which often benefits from corporate travel data analytics to manage thousands of employee expenses, to automating reconciliation in b2b transactions where invoice discrepancies can delay crucial vendor payments.
The pressure is driven by volume and velocity. As businesses scale—whether in high-frequency ecommerce or global SaaS—the need for real-time domestic transaction reconciliation solutions increases. Delays in identifying a mismatch mean delays in closing the books, which ultimately delays financial reporting. When a spreadsheet crashes because the data volume is too high, or when a manual match fails because of a trailing space in a text field, the entire financial reporting pipeline grinds to a halt.
The landscape: spreadsheets vs. "black box" automation
When looking for a solution, payment operations teams often find themselves stuck between two extremes in the search results, neither of which fully solves the problem for the mid-market or agile technical team.
On one side, there are manual spreadsheets, which often lead teams to seek an excel alternative. They are flexible and familiar, allowing for quick ad-hoc analysis. However, they are brittle. They lack the processing power for large datasets, and the logic is hidden inside individual cells, making it difficult to audit.
On the other side, there is the world of enterprise SaaS. While there are dedicated transaction reconciliation software suites and best expense automation tools for automatic transaction reconciliation available, they often operate as "black boxes." Data goes in, and results come out, but the specific matching logic is often hard-coded and inaccessible. Furthermore, these tools can be prohibitively expensive and require months of implementation time to integrate with existing banking APIs.
This creates a void for the "technical operator"—the analyst who knows exactly how the data needs to be matched but lacks the tool to do it efficiently. This is where the "glass box" approach of Quadratic fits in. By bringing Python directly into the spreadsheet grid, analysts can maintain the flexibility of a sheet while ensuring the matching logic is transparent, auditable, and capable of handling millions of rows.
Step-by-step: building a transparent reconciliation workflow
To understand how this works in practice, consider a workflow where a payment operations specialist needs to reconcile a massive internal ledger against a report from a payment service provider. The goal is to verify transaction statuses, amounts, and merchant IDs to produce a clean audit report. Here is how that workflow evolves from a manual struggle to an automated script in Quadratic.
1. Data ingestion: beyond the row limit
The first hurdle in standard reconciliation is simply opening the file. Financial service provider reports often come as massive CSVs that can choke standard spreadsheet applications. In a code-enabled workflow, this limitation disappears.
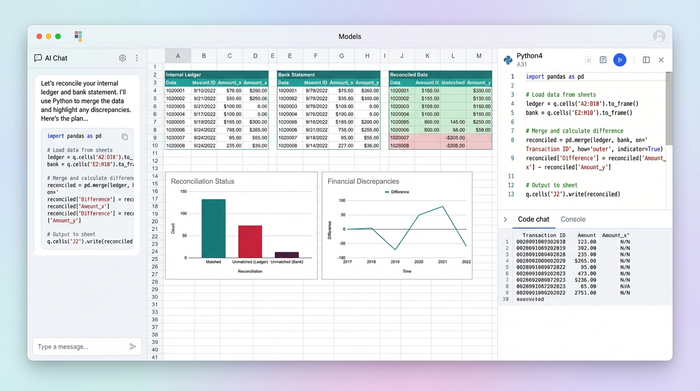
Instead of manually copying and pasting data, the analyst uses a Python script to ingest the data. This can be done by uploading the CSV directly or by connecting to an API or SQL database. Because Quadratic handles data processing on a server-side backend rather than relying solely on browser memory for rendering every cell, it can ingest and process datasets that are far larger than the typical row limit. This capability allows for real-time reconciliation solutions for domestic transactions, where data is pulled live from a database, processed, and displayed without the user ever having to worry about the application freezing.
2. The matching logic: Python over VLOOKUP
Once the data is in the environment, the actual reconciliation begins. In a traditional workflow, this involves drag-down formulas like VLOOKUP or INDEX-MATCH. These are prone to human error—if a row is inserted or deleted, the reference shifts, and the reconciliation breaks.
In Quadratic, the analyst replaces these fragile formulas with a Python script using the Pandas library. The script can be written to perform a "merge" or "join" operation based on multiple criteria simultaneously, such as the Merchant ID, the transaction amount, and the timestamp.
Crucially, Python allows for data normalization before matching. For example, if the internal log stores the Merchant ID as a number but the bank report stores it as text, a standard spreadsheet match would fail. A Python script can instantly convert both columns to a string format to ensure accurate matching. This approach offers a superior alternative to rigid rpa solutions for credit unions needing real-time transaction reconciliation, as the logic is fully editable and visible right there in the sheet. If the matching criteria change, the analyst simply updates a line of code rather than rewriting thousands of formulas.
3. Categorizing and grouping results
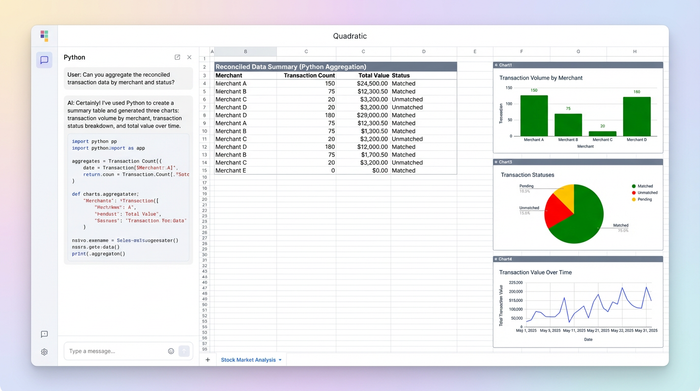
After the datasets are joined, the user needs to make sense of the results. The objective is usually to produce grouped summaries—for instance, a table showing transaction counts and total values grouped by merchant and request type.
Using Python, the analyst can aggregate this data instantly. The output is a clean summary dataframe that displays exactly how many transactions were processed for each merchant and the total value. In Quadratic, this summary table can be output to a specific location on the infinite canvas. Unlike a standard pivot table that might overlap with existing data if it expands, the infinite grid allows the analyst to place the raw data, the reconciliation logic, and the summary report side-by-side without fear of collision.
Handling exceptions: the key to audit readiness
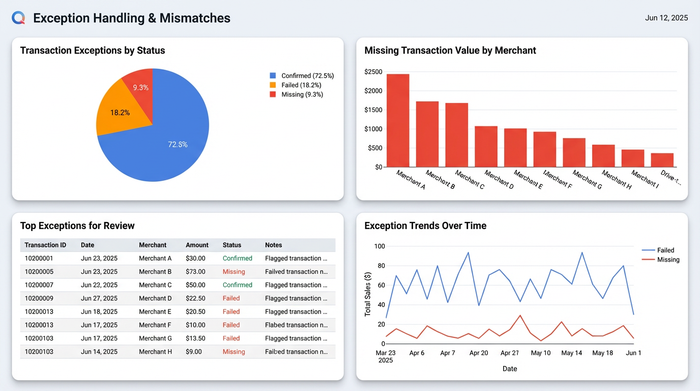
In audit scenarios, the matches are boring; it is the mismatches that matter. True audit readiness comes from how effectively a team handles exceptions. A robust reconciliation workflow must be able to isolate "breaks"—transactions that appear in one ledger but not the other, or transactions where the status differs (e.g., "Pending" vs. "Settled").
Using the same Python script, the analyst can generate a comprehensive exception report. This report categorizes every line item into buckets: Confirmed, Failed, or Missing. This level of granularity is essential for bank transaction reconciliation solutions, where every penny must be accounted for.
This workflow provides a distinct advantage during an external audit. Because the matching logic is written in code, an auditor can read the script and understand exactly how the reconciliation was performed. It serves as a "glass box," offering total transparency. In contrast, auditing a spreadsheet requires clicking through individual cells to trace dependencies, a process that is opaque and prone to error.
Best practices for automated reconciliation tools
Whether you are evaluating automated reconciliation tools for ecommerce transactions and bank deposits or building your own workflow in Quadratic, there are specific features that define a robust system, often aligning with ITP best practices in institutional trade processing.
First, flexibility is paramount. No two payment processors format their reports exactly the same way. The tool must allow you to customize the matching logic to account for specific quirks in the data, such as time zone differences or truncated merchant names.
Second, data integrity is non-negotiable. The tool should treat source data as immutable. In Quadratic, your raw data remains untouched while the Python script reads it and generates a new set of results. This ensures that you never accidentally overwrite the original bank record.
Finally, speed is critical. As the industry moves toward real-time settlements, the ability to run a reconciliation script in seconds rather than hours allows finance teams to catch fraud or errors immediately, rather than at the end of the month.
Conclusion: the future of payment operations
Mastering transaction reconciliation is about more than just finding a tool that doesn't crash; it is about combining the right data with the right process to ensure accuracy and compliance. For too long, finance professionals have felt forced to choose between the flexibility of a breaking spreadsheet and the rigidity of a six-figure software contract.
That choice is no longer necessary. By adopting a technical operator approach and utilizing tools like Quadratic, teams can build audit-ready, automated workflows that scale with their business. You can have the power of a programmatic data pipeline with the familiarity of a spreadsheet interface. If you are ready to stop fighting with row limits and start building a transparent financial workflow, try building your first reconciliation script in Quadratic today.
Use Quadratic to do transaction reconciliation
- Ingest and process massive transaction datasets that overwhelm traditional spreadsheets, eliminating row limits and crashing files.
- Replace fragile, error-prone manual VLOOKUPs with robust Python scripts for transparent, auditable matching logic.
- Normalize disparate data formats (e.g., text vs. numbers) automatically before matching, ensuring accuracy across varied reports.
- Generate comprehensive exception reports to quickly identify mismatches and outstanding items crucial for audit readiness.
- Customize matching rules with Python to adapt to unique quirks in payment processor reports and internal ledgers.
- Run reconciliation scripts in seconds, enabling real-time insights to catch errors or fraud immediately.
Ready to build transparent, auditable transaction reconciliation workflows? Try Quadratic.