
Table of contents
- The challenge: managing multi-source environmental data
- Centralizing data: from lab results to structured tables
- Automating data cleaning and standardization
- Calculating risk indices with Python in the grid
- Visualizing health impacts for reporting
- Conclusion
- Use Quadratic to streamline microplastics analysis
Environmental health research has shifted from simple quantification to complex correlation. It is no longer enough to count particles; modern research demands that we understand how these particles interact with other pollutants, such as pesticides, and what that means for biological health. However, the workflow for microplastics analysis often hits a bottleneck when researchers attempt to merge these massive, disparate datasets in traditional spreadsheet software.
Researchers frequently struggle with "messy" data management, juggling multiple sheets where one tab holds water sample counts and another contains biological impact data. When trying to correlate these factors to assess risk, standard spreadsheets often crash or suffer from broken reference links. To solve this, researchers are turning to Python-enabled spreadsheets like Quadratic. This approach bridges the gap between raw data collection and sophisticated risk modeling, allowing scientists to maintain the visual simplicity of a spreadsheet while leveraging the power of code to handle complex microplastic analysis workflows.
The challenge: managing multi-source environmental data
The primary hurdle in modern environmental toxicology is the variety of data sources, leading to known challenges in environmental toxicology data management. A single study might combine spectral data from various identification methods in microplastic analysis, such as FTIR or Raman spectroscopy, with chemical concentration data from gas chromatography. These datasets are fundamentally different in structure and scale, making them difficult to align.
Data silos create significant risks for error. For example, manually correlating microplastic analysis in water with biological data, such as tissue accumulation in aquatic life, usually relies on fragile spreadsheet formulas like VLOOKUP. These formulas are prone to breaking when rows are sorted or new data is added, potentially compromising the integrity of a study.
In a recent use case, a researcher needed to manage distinct datasets for microplastics and pesticide concentrations to create a holistic risk assessment. The goal was to determine if the presence of microplastics exacerbated the toxicity of pesticides, a growing area of research into microplastic and pesticide co-exposure toxicity. Doing this in a standard grid was nearly impossible without constant manual intervention, highlighting the need for a more robust data environment.
Centralizing data: from lab results to structured tables
The first step in a modernized workflow is ingesting and structuring the raw data. In Quadratic, this process moves away from manual copy-pasting and toward automated data pulling. The researcher can organize multi-sheet datasets where distinct environments are kept separate but accessible.
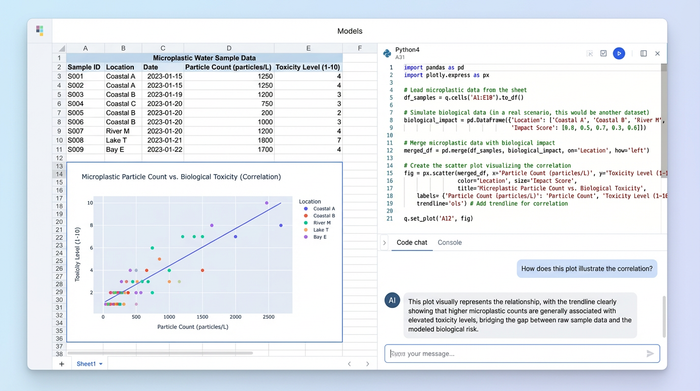
For instance, Sheet 1 might contain the analysis of microplastics in water, detailing particle sizes, polymer types, and concentrations. Sheet 2 might contain the solutions for microplastics analysis in bio organisms, holding data on tissue samples, lipid content, and pollutant load.
The advantage of using a Python-enabled grid is the ability to pull data from these separate sheets using SQL or Python directly within a cell. Instead of dragging formulas down a million rows, the researcher can write a simple query to join the water quality data with the tissue sample data based on sample ID or location. This creates a clean, merged master table that serves as the foundation for all subsequent analysis, ensuring that the input data remains unaltered while the analysis table updates dynamically.
Automating data cleaning and standardization
A common frustration in environmental science is the inconsistency of units. Lab results often arrive in different formats; one team might report concentrations in particles per liter, while another reports in milligrams per liter. In a traditional workflow, standardizing these units requires creating helper columns and manual division, which clutters the sheet and invites error, underscoring the need for robust environmental data standardization best practices.
In Quadratic, Python cells allow for scripted data cleaning. The researcher can write a short Python script to standardize units across the entire dataset instantly. Whether the incoming data is derived from visual counting or advanced hplc fluorescence microplastics analysis, the cleaning pipeline ensures uniformity.
If a new batch of data arrives with different units, the script automatically processes it according to the defined logic. This creates a reproducible cleaning process that saves hours of manual checking and ensures that the dataset is uniform before any statistical modeling begins.
Calculating risk indices with Python in the grid
Once the data is clean and merged, the workflow shifts to scientific rigor. To assess the true impact of pollutants, researchers need to move beyond simple sums and averages. They need to calculate specific Risk Indices and Exposure Margins to quantify the potential harm to the ecosystem.
Using Python libraries like Pandas or NumPy directly in the spreadsheet grid, the researcher can run complex statistical formulas on the merged data. For example, they can calculate the Polymer Hazard Index (PHI) or Risk Quotient (RQ) for every sample site simultaneously.
This method offers a significant advantage in reproducibility, a critical factor highlighted by organizations like The Alan Turing Institute for the importance of reproducibility in environmental science. Because the logic is written in visible code rather than hidden cell formulas, the microplastics analysis methods are transparent. Peer reviewers or collaborators can click on a cell and see exactly how the risk index was derived. This transparency makes the research audit-ready and significantly easier to defend during the publication process.
Visualizing health impacts for reporting
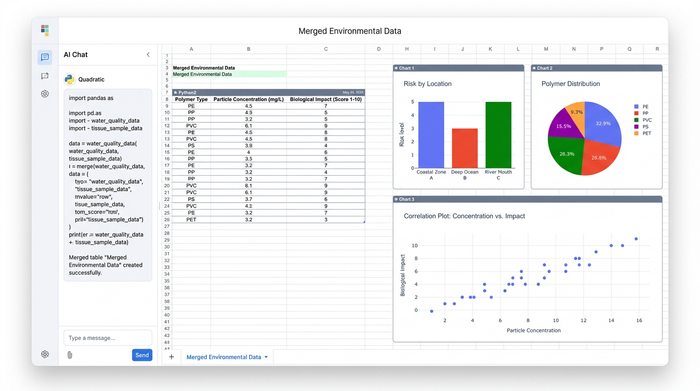
The final stage of the workflow is communicating the findings. Data tables are essential for calculation, but visualizations are necessary for decision-making. In this workflow, the researcher uses Python plotting libraries, such as Matplotlib or Plotly, to generate high-quality figures directly inside the spreadsheet interface.
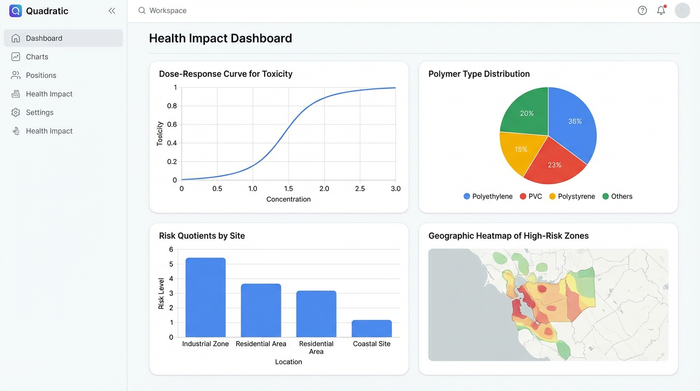
Researchers can create dose-response curves to show how toxicity increases with microplastic concentration, or generate pollution heatmaps to identify high-risk geographic zones. Unlike static charts in traditional tools, these visualizations are dynamic.
This "live" aspect is a key differentiator for ongoing monitoring projects. If new samples are added to the microplastic analysis in water sheet, the risk assessment calculations run again, and the charts update automatically. This allows the researcher to maintain a living document of the environmental health status, rather than a static snapshot that becomes obsolete as soon as the next sample is processed.
Conclusion
Modern microplastics analysis requires tools that are as sophisticated as the science itself. As research questions become more complex—linking physical pollutants with chemical toxicity and biological health—the tools used to analyze them must evolve.
By moving from static, fragile spreadsheets to a dynamic, code-powered environment, researchers can bridge the gap between data collection and insight. This workflow allows scientists to focus less on the drudgery of data management and more on interpreting health impacts and risks. For those handling complex environmental datasets, adopting a tool like Quadratic can transform a cumbersome process into a streamlined, reproducible, and rigorous scientific workflow.
Try Quadratic, the AI spreadsheet that does your work for you
Use Quadratic to streamline microplastics analysis
- Merge diverse environmental datasets: Combine spectral, chemical, and biological data from multiple sources into a single, dynamic workspace, eliminating crashes and broken links common in traditional spreadsheets.
- Automate data ingestion and structuring: Pull and join microplastic and co-pollutant data from separate sheets using SQL or Python, creating a clean, master table that updates automatically for comprehensive risk assessments.
- Standardize inconsistent lab units instantly: Write Python scripts directly in the grid to unify units (e.g., particles/L to mg/L) across all incoming data, ensuring consistency without manual, error-prone conversions.
- Calculate complex risk indices transparently: Leverage Python libraries like Pandas or NumPy to compute Polymer Hazard Index (PHI) or Risk Quotient (RQ) within cells, providing reproducible and auditable methodology for peer review.
- Generate dynamic, high-quality visualizations: Create dose-response curves, pollution heatmaps, and other plots with Matplotlib or Plotly that automatically update as new microplastics data is added, maintaining a living document of environmental health.
Ready to simplify your environmental health research workflow? Try Quadratic.