
Table of contents
- Why "dynamic" is the holy grail of productivity sheets
- Step 1: Setting the stage on the infinite canvas
- Step 2: Automating dates with Python (no complex formulas)
- Step 3: Designing the visual logic
- Step 4: Extending the system (gamification & metrics)
- Conclusion: A personal productivity spreadsheet that lasts a lifetime
- Use Quadratic to build a dynamic habit calendar
There is a specific cycle that productivity enthusiasts know all too well. It usually happens in late December or early January. You sit down to organize your life, searching for the perfect system to track your goals. You might download a template or build a grid yourself, carefully typing out dates and dragging formulas across columns. It works perfectly—until February ends.
The moment the month changes, or worse, the year rolls over, the system breaks. You are forced to manually add rows, fix broken references, or copy-paste formatting. This maintenance fatigue is one of the primary reasons people abandon their habits. To build a truly sustainable system, you need a personal productivity spreadsheet that adapts automatically.
By moving beyond standard spreadsheet functions and utilizing Quadratic’s ability to automate spreadsheets with Python, you can build a dynamic habit calendar that updates itself forever. This approach solves the "leap year anxiety" that plagues standard templates and creates a tool where you can change a single cell—the year—and watch the entire calendar instantly restructure itself for the next 365 days.
Why "dynamic" is the holy grail of productivity sheets
In the context of spreadsheet design, "dynamic" means that the structure of your data is not hard-coded into the cells, a concept often contrasted with static and dynamic reports. In a static sheet, you type "Monday, Jan 1" into cell A2. In a dynamic sheet, cell A2 asks, "What year is it?" and generates the correct date and day of the week automatically.
Achieving this in traditional spreadsheets like Excel or Google Sheets often requires "formula gymnastics," a complexity largely avoided in a modern coding spreadsheet. Users are forced to write fragile, complex logic involving SEQUENCE, LAMBDA, or nested IF statements just to determine if February has 28 or 29 days. If you accidentally delete a row, the chain breaks.
The Quadratic advantage is that we replace this brittle logic with readable code. By using a few lines of Python, we can handle date math, leap years, and grid generation instantly. The result is a clean interface for tracking habits, powered by a sturdy backend that never needs manual adjustment.
Step 1: Setting the stage on the infinite canvas
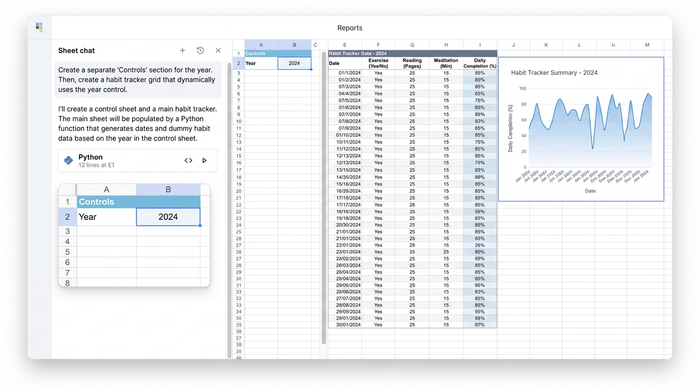
The first step in building this system takes advantage of Quadratic’s infinite canvas. In traditional spreadsheets, users often hide "helper columns" or cram settings into the top rows to keep them out of sight. In Quadratic, you can spatially separate your "Controls" from your "Tracker."
The user in this use case began by creating a dedicated control area. Here, they established a variable for the current year. By designating a specific cell (e.g., cell B2) as year = 2024, they created a global reference point.
This small step is crucial. Instead of hard-coding "2024" into fifty different formulas, every part of the spreadsheet now looks to this one cell for instruction. When 2025 arrives, the user simply types "2025" into that single cell, and the Python scripts running the rest of the sheet will automatically recalculate the entire year's layout.
Step 2: Automating dates with Python (no complex formulas)
This is where the automated habit tracker comes to life. Instead of dragging a date formula down 365 rows, we use Python to generate the calendar logic. Python has a built-in calendar library that handles all the complexities of time for us.
In a Python code cell, the user can write a simple script to generate the dates. It looks something like this:
import calendar

import pandas as pd

c = calendar.Calendar()

year_dates = []

for month in range(1, 13):

for date in c.itermonthdates(year, month):

if date.month == month:

year_dates.append(date)

pd.DataFrame(year_dates)
This script does the heavy lifting. It identifies exactly how many days are in each month and, crucially, it handles the leap year logic natively. A standard leap year spreadsheet formula is often a messy nested conditional statement checking if the year is divisible by 4 but not 100, unless divisible by 400. In Python, the calendar library already knows this. You do not need to write the logic; you just ask for the dates.
The output is a perfect, vertical array of dates spilling into the grid. Because this is Python, the data is robust. It cannot be broken by accidentally typing over a cell in the middle of the sequence, as the code cell controls the output range.
Step 3: Designing the visual logic
With the raw dates generated, the next step is transforming the data into a usable interface. A habit tracker needs to be visually intuitive, resembling an application rather than a database.
Using the date array generated in the previous step, the user utilized Python to dynamically generate the corresponding Day Headers (Mon, Tue, Wed). This ensures that if Jan 1st shifts from a Monday to a Tuesday in the following year, the headers shift with it automatically.
To finalize the visual logic, conditional formatting plays a vital role. The user applied rules to:
1. Highlight the "Today" row so the current entry point is always obvious.
2. Grey out "overflow dates" or separate months visually to break up the wall of data.
3. Distinguish weekends to allow for different habit routines on Saturdays and Sundays.
The result is a clean, visual grid that looks and feels like a dedicated habit app. However, unlike a rigid app, you have full access to the underlying data.
Step 4: Extending the system (gamification & metrics)
Because the foundation of this calendar is built on code, extending it is significantly easier than modifying a standard spreadsheet. The search results for habit trackers often highlight a desire for "gamification"—features like streaks, completion percentages, and progress bars.
In a standard sheet, adding a dashboard often risks breaking the calendar grid if you insert columns or rows. On Quadratic’s infinite canvas, you can build a dashboard to the right of your calendar without affecting the structure.
You can use SQL or Python to query the calendar data directly. For example, you could write a quick SQL query to count how many times you checked "Exercise" in the last 30 days. This creates a feedback loop where your input (the habit grid) instantly feeds your analytics (the dashboard), which can be enhanced using Python libraries for data visualization, all without fragile cell references.
Why this is better than a template
Many users start by searching for a habit tracking template, hoping to save time. The problem with templates is that they are someone else's logic pasted into your workbook. If you want to change a habit from daily to weekly, or track a metric that isn't a simple checkbox, templates often break. By building the logic in Quadratic using Python, you gain ownership. You understand that the code generates the dates, giving you the confidence to customize the tracking columns however you see fit.
Conclusion: A personal productivity spreadsheet that lasts a lifetime
A personal productivity spreadsheet should not require a monthly maintenance rituals just to keep it running. By swapping brittle formula chains for robust Python libraries, you move from "maintaining" your tools to actually using them.
The user in this case successfully built a dynamic habit calendar that requires zero setup when the new year arrives. They simply update the year variable, and the Python code handles the rest—leap years, day shifts, and formatting included.
If you are tired of rebuilding your tracker every January, try building your own system in Quadratic. You can clone a dynamic template or use the calendar library to script your own solution, creating a tool that is as permanent and reliable as the habits you are trying to build.
Use Quadratic to build a dynamic habit calendar
- Automatically generate and update your entire habit calendar for any year by changing a single cell, eliminating manual updates and broken formulas.
- Handle complex date math, leap years, and day shifts robustly with simple Python code, bypassing fragile "formula gymnastics."
- Spatially separate your calendar controls from your tracking grid on an infinite canvas, making your sheet clean, organized, and easy to extend.
- Easily integrate gamification features and analytics dashboards using SQL or Python without risking the integrity of your core calendar.
- Build a custom personal productivity spreadsheet where you own the logic, ensuring it adapts to your needs and never becomes an abandoned template.
Ready to stop rebuilding your productivity tools every year? Try Quadratic.