
Table of contents
In quantitative research, a survey is only as valuable as its consistency. If a respondent answers similar questions differently within the same session, the data is flawed, and any conclusions drawn from it are suspect. To ensure a measurement instrument is trustworthy, researchers rely on tests of internal consistency reliability. One of the most direct methods for establishing this is split-half reliability.
Split-half reliability is a statistical method used to measure the internal consistency of a test or survey. It involves dividing the test into two distinct parts and comparing the scores to see if they correlate. If the two halves produce similar results, the instrument is considered reliable.
However, calculating this metric has traditionally been a "black box" experience. Researchers often rely on legacy software like SPSS, clicking through opaque dropdown menus to generate a static output table. If the data changes, the entire process must be repeated manually.
Quadratic offers a modern alternative. By bringing Python directly into the Python spreadsheet, you can calculate reliability transparently. This "glass box" approach allows you to see the logic behind the split, verify the math, and build a reproducible workflow that updates instantly as your data evolves.
What is split-half reliability?
At its core, split-half reliability checks whether different parts of a test measure the same construct. It is a fundamental concept in psychometrics used to determine if a scale—such as a depression inventory or a customer satisfaction survey—is internally consistent.
If you are looking for a clear split half reliability psychology definition, it is the correlation between two halves of a test, corrected for the shortened length of the parts. This concept is so foundational that it appears in everything from advanced clinical research to introductory coursework; even a split half reliability AP psychology definition will emphasize that a reliable test must yield consistent results regardless of how it is sliced.
To understand what is split half reliability in practice, you must look at how the test is divided. There are two common ways to split the items:
- First-Half/Second-Half: This method splits the test right down the middle (e.g., questions 1–10 vs. 11–20). This is often discouraged because of respondent fatigue. A person might focus less on the second half, artificially lowering the correlation.
- Odd-Even Split: This is the preferred method for most researchers. It compares odd-numbered questions (1, 3, 5) against even-numbered questions (2, 4, 6). This is the preferred method for most researchers, and a concise definition can be found under odd-even reliability. This balances the effects of fatigue or practice across both halves.
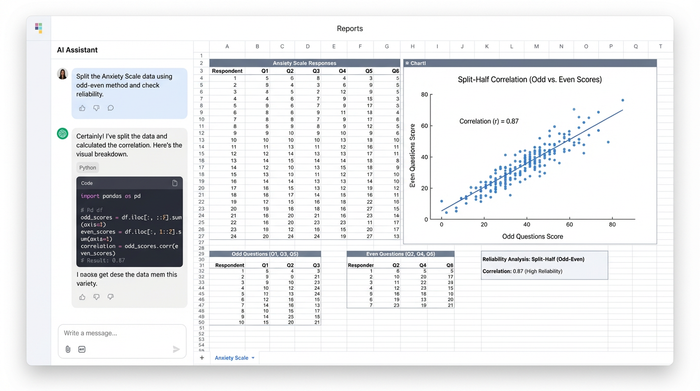
Consider a split half reliability example involving a 20-item anxiety scale. If the scale is reliable, a respondent with high anxiety should score high on both the odd questions and the even questions. If they score high on the odds but low on the evens, the scale is likely inconsistent.
The math behind the metric: correlation and Spearman-Brown
Calculating this metric involves two distinct mathematical steps. First, you determine the relationship between the two halves. Second, you correct that number to account for the test's length.
The first step is calculating the correlation coefficient (usually Pearson's r) between the total score of the first half and the total score of the second half. However, correlation alone is not the final reliability score.
Reliability is influenced by the length of a test. Generally, longer tests are more reliable than shorter ones. When you split a 20-item survey into two 10-item halves to calculate correlation, you are effectively estimating the reliability of a test that is only half as long as the original. This results in an underestimated reliability score.
To fix this, researchers use the Spearman-Brown prophecy formula. This formula adjusts the correlation to estimate the reliability of the full-length test.
The formula is:
$$r_{sb} = \frac{2r}{1+r}$$
Here is a quick split-half reliability example of the math in action. Imagine the correlation ($r$) between your odd and even items is 0.60. If you reported 0.60 as your reliability, you would be underselling your survey. Applying the Spearman-Brown formula:
1. Multiply the correlation by 2: $0.60 \times 2 = 1.2$
2. Add 1 to the correlation: $1 + 0.60 = 1.6$
3. Divide the results: $1.2 / 1.6 = 0.75$
The corrected reliability is 0.75, which is significantly higher and more accurate for the full instrument.
Tutorial: calculating split-half reliability in Quadratic
Legacy tools hide these steps behind menus. In Quadratic, we can build a reliability calculator using Python directly in the spreadsheet. This ensures that your research is reproducible and that the logic defining your "split" is visible to anyone auditing the data.
Step 1: ingesting the survey data
Begin by bringing your dataset into the Quadratic grid. This might be a CSV export from Qualtrics or SurveyMonkey. Each row represents a respondent, and each column represents a question item (e.g., Q1, Q2, Q3... Q20).
Step 2: splitting the scale (the Python workflow)
In a standard tool, you might have to manually copy-paste columns to separate odds and evens, which is prone to error. In Quadratic, you use Python to slice the data programmatically.
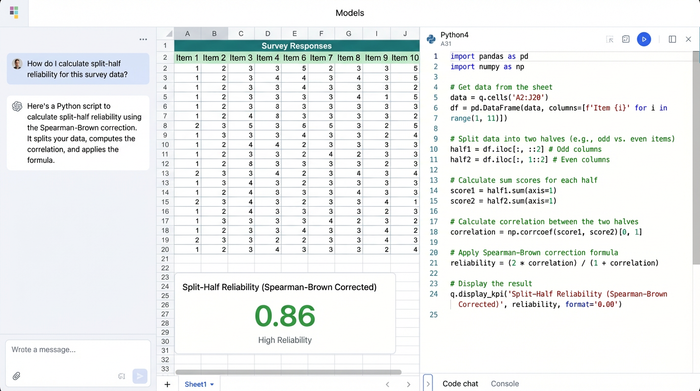
You can write a simple script in a code cell to define your halves. Using a library like Pandas, the logic looks like this:
evens = data.iloc[:, ::2]
odds = data.iloc[:, 1::2]
This code tells the system to take every second column starting from index 0 for evens, and every second column starting from index 1 for odds. The benefit here is transparency. You can verify exactly which columns are included in the calculation simply by reading the code cell living next to your data.
Step 3: calculating the correlation
Once the data is split, you sum the scores for each respondent in both groups. You then run a correlation function between the "Odd Totals" and "Even Totals."
In Quadratic, this happens in the same script. You instantly get the raw correlation coefficient ($r$) without navigating away from your data.
Step 4: applying Spearman-Brown
Finally, you apply the correction formula within your Python cell. You can define a simple function that takes your correlation $r$ and returns the corrected score.
You can reference it in other cells or use it to trigger alerts if reliability drops below a certain threshold (e.g., 0.70), often considered a reliability coefficient of .70 or higher as acceptable in social science research.
Step 5: visualizing the result
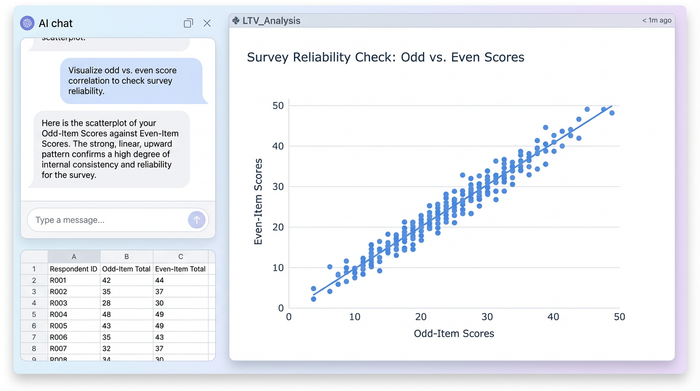
Numbers tell part of the story, but visuals confirm it. A high reliability coefficient should mean that if you plot "Odd Scores" on the X-axis and "Even Scores" on the Y-axis, the dots should form a tight, linear shape.
In Quadratic, you can generate this scatterplot using Python visualization libraries like Plotly or Matplotlib directly in the grid. If the scatterplot looks like a dispersed cloud rather than a line, you know immediately that your scale has consistency issues, regardless of what the raw number says. This visual check is a powerful differentiator that static text outputs lack.
Split-half reliability vs. Cronbach’s alpha
When researching split half reliability psychology methods, you will inevitably encounter Cronbach’s alpha. A common question is: which one should you use?
Cronbach’s alpha is currently the standard in most academic journals. Mathematically, alpha is the average of all possible split-half reliability coefficients. It is robust and preferred for final publication.
However, split-half reliability remains highly useful in specific contexts:
- Speed and Simplicity: It is computationally faster and easier to explain to non-statistical stakeholders.
- Large Datasets: For massive datasets where calculating every permutation is resource-intensive, split-half provides a quick, accurate proxy.
- Planned Splits: If a test is designed with two parallel sub-forms (e.g., Form A and Form B mixed together), split-half is the mathematically correct way to analyze it, not Alpha.
Why transparency matters in psychometrics
The shift from rigid statistical software to code-based spreadsheets like Quadratic is about more than just convenience. It is about the integrity of the research.
In a transparent workflow, the path from raw data to final reliability score is unbroken. If you realize a respondent entered "99" instead of "9" and correct the cell in the grid, Quadratic automatically re-runs the Python code, updates the correlation, re-applies the Spearman-Brown correction, and redraws the scatterplot.
There is no need to re-open a menu or re-run a script manually. The audit trail is built into the document. Anyone reviewing your work can click the code cell and see exactly how the odds and evens were defined, ensuring that no manual copy-paste errors corrupted the analysis.
Conclusion
Split-half reliability is a vital check for any researcher who cares about data quality. It ensures that the survey instrument is measuring a construct consistently. While the math behind it—correlation and the Spearman-Brown prediction—is established, the tools we use to calculate it are changing.
Moving from "black box" legacy software to a transparent, Python-enabled environment gives you more control. It allows you to visualize the relationship between your data points and ensures your analysis is reproducible. By using Quadratic, you turn a static statistical check into a dynamic part of your data workflow.
Ready to validate your survey data with transparency? Try the split-half reliability workflow in Quadratic.
Use Quadratic to calculate split-half reliability
- See the logic behind your calculations: Move from "black box" legacy software to a transparent "glass box" approach by writing and seeing your Python code directly in the spreadsheet, ensuring full visibility into how your data is split and processed.
- Build reproducible and dynamic workflows: Automate the entire split-half reliability process using Python, so your analysis updates instantly and accurately whenever your raw survey data changes, without manual re-runs.
- Programmatically split and analyze data with precision: Use Python to define odd and even item sets, eliminating manual errors from copy-pasting and ensuring consistent, accurate calculation of correlation and the Spearman-Brown correction.
- Verify consistency visually and statistically: Generate interactive scatterplots with Python visualization libraries directly in your spreadsheet, providing an immediate visual check alongside your numerical reliability coefficient.
- Maintain a clear audit trail: Keep your data, code, and results in a single, collaborative environment where every step of your split-half reliability analysis is visible and verifiable.
Ready to validate your survey data with transparency? Try Quadratic.