Table of contents
- The "big three" metrics for construction oversight
- Why standard tools struggle with actionable insights
- Case study: building an operational dashboard in Quadratic
- Visualizing the data: summary statistics & prioritization
- Conclusion: choosing the right tool for the job
- Use Quadratic to track subcontractor performance
Subcontractor performance is often the single biggest variable in project profitability. When a framing crew falls behind schedule or a concrete sub delivers inconsistent daily logs, the ripple effects touch every part of the project timeline. For construction managers and project controls specialists, the challenge isn't just collecting data; it is identifying where a subcontractor is slipping early enough to fix it.
Most tools to track subcontractor performance fall into two frustrating categories. First, there are the heavy, rigid software platforms like Procore or Oracle Primavera. These are powerful but often expensive and difficult to customize to a specific project's workflow. On the other end of the spectrum are manual spreadsheets. While flexible, they are prone to broken formulas, version control issues, and stale data that requires hours of manual entry every Friday afternoon.
There is a third way: the connected spreadsheet. By using a tool like Quadratic, which combines the familiarity of a spreadsheet with the power of Python and SQL, managers can build automated risk detection systems, leveraging established risk detection methodologies that standard Excel sheets cannot handle. This article outlines the essential metrics for construction oversight and demonstrates how a construction manager used Quadratic to build a dashboard that turns raw daily logs into actionable risk alerts.
The "big three" metrics for construction oversight
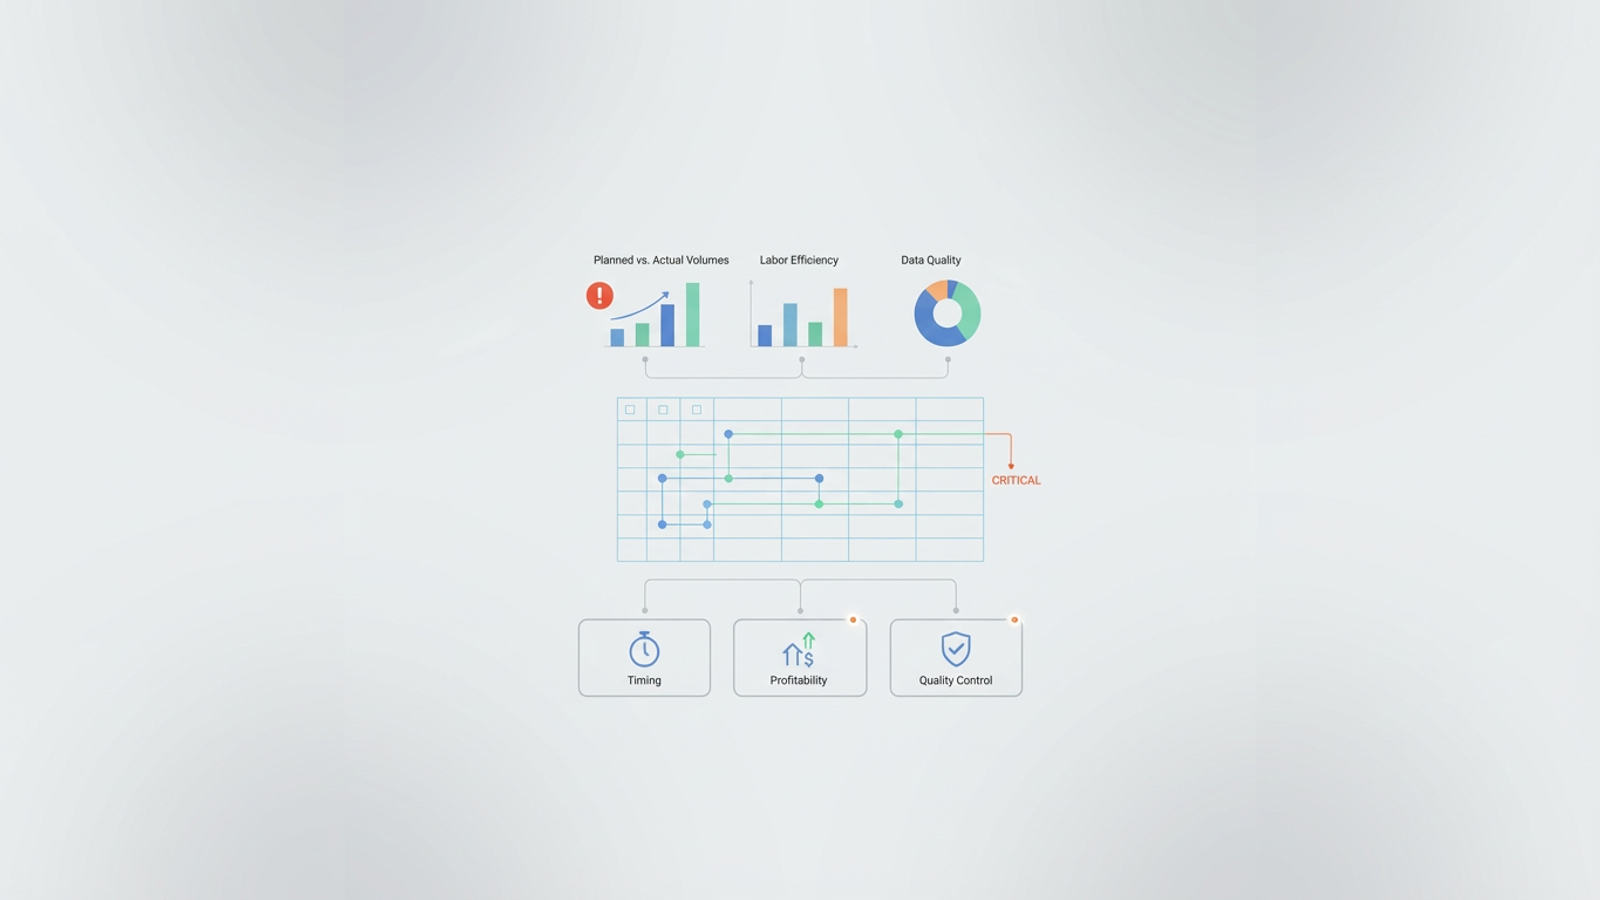
Before diving into the technical setup, it is important to define what actually needs to be measured. While every project has unique KPIs, three specific areas provide the highest return on investment for monitoring performance.
1. Planned vs. actual volumes
This is the baseline of construction dashboard metrics. You need to track specific work types—such as linear feet of framing, cubic yards of concrete, or square footage of drywall—against the schedule. The goal is to identify volume deviations immediately. If a sub was scheduled to complete 500 units but only completed 350, that deficit needs to be flagged instantly, not discovered during the monthly draw meeting.
2. Labor efficiency & deviation
Tracking personnel hours against output is critical for spotting labor variance. If a subcontractor has a full crew on-site but production volume is low, efficiency is dropping. Conversely, if production is high but the headcount is lower than expected, you may face burnout or quality issues down the line. correlating headcount logs with installed quantities gives you a view of true performance.
3. Data quality (the hidden metric)
Most articles on construction KPI automation ignore this, but it is vital. Data quality is a performance metric in itself. If a subcontractor consistently submits incomplete logs, leaves fields blank, or submits data days late, that is a performance failure. A good dashboard should not just display data; it should flag missing or anomalous entries so you can push back on the contractor for better reporting.
Why standard tools struggle with actionable insights
The primary issue with traditional reporting is the "rear-view mirror" problem. Most tools report on what already happened. A standard monthly report might show that you are over budget or behind schedule, but by the time you read it, the damage is done. Construction managers need tools that alert them to risk, helping them in identifying early warning signs in projects before a delay becomes unmanageable. Standard spreadsheets struggle to provide this forward-looking view due to "formula fatigue." Trying to build complex logic—such as "If volume deviation is greater than 10% AND labor efficiency is trending down, flag this as High Risk"—requires nested formulas that are brittle and hard to audit. If someone accidentally deletes a cell or drags a formula incorrectly, the entire risk model breaks.
This was the exact situation facing a construction manager who turned to Quadratic. They needed a dashboard that didn't just display rows of numbers but prioritized actions based on automated logic.
Case study: building an operational dashboard in Quadratic
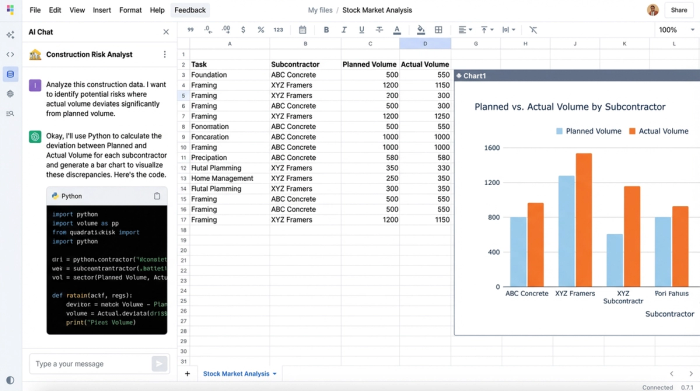
In this real-world workflow, a construction manager set out to create an operational dashboard to monitor contractor performance across various activities. The goal was to move away from rigid software and fragile Excel sheets toward a system that could ingest daily logs and automatically calculate risk.
The foundation was a clean data structure. The manager set up the sheet to ingest logs that tracked work types, planned volumes, actual volumes, and personnel counts. In a standard spreadsheet, this data would sit statically until someone manually manipulated it. In Quadratic, the manager used Python to bring the data to life.
Automating the logic with Python
Instead of relying on complex spreadsheet formulas that need to be dragged down thousands of rows, the manager used Python scripts directly within the cells. This allows for construction KPI automation that is both robust and readable.
Whenever new daily logs are added to the dataset, the Python code runs automatically, recalculating the variance for every subcontractor. This type of automated data processing ensures that the metrics are always live and accurate without the risk of human error in formula application.
From data to "risk status" alerts
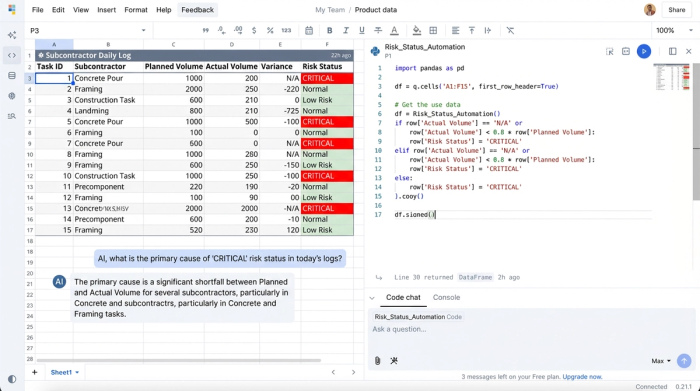
The most powerful part of this workflow was the creation of a "Risk Status" column. Rather than asking the project team to scan hundreds of rows to find issues, the manager scripted logic to do the scanning for them.
The logic worked like this: If the Actual Volume was less than 80% of the Planned Volume AND the Labor Efficiency showed a downward trend, the Python script automatically tagged that row as "CRITICAL." If the data was incomplete, it was tagged as "DATA ERROR." This simple automation shifted the team's workflow from reading rows to managing exceptions. They no longer had to look for problems; the dashboard brought the problems to them.
Visualizing the data: summary statistics & prioritization
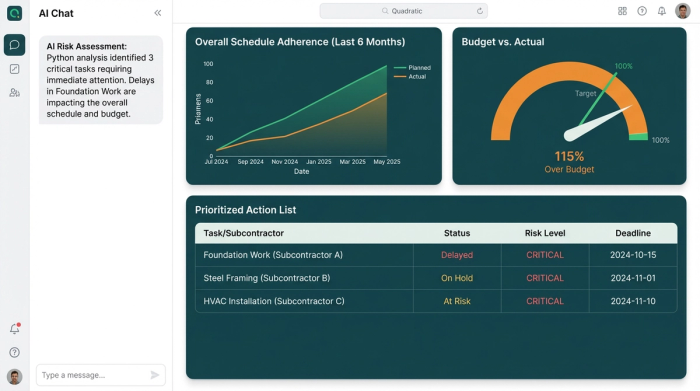
The final layer of the system was visualization. The manager built a dashboard view that sat on top of the raw data, providing a clear window into project health.
This view included summary statistics that aggregated the total project performance, showing high-level trends in schedule adherence and budget. More importantly, it featured a prioritized action list. By filtering the data based on the Python-generated "Risk Status," the dashboard displayed only the subcontractors or work types currently flagged as "High Risk" or "Critical."
This view also addressed the data quality metric. If a subcontractor failed to submit their personnel logs, the dashboard highlighted those specific gaps. This allowed the project controls specialist to call the sub immediately and demand better reporting, ensuring the integrity of the project data remained high.
Conclusion: choosing the right tool for the job
Effective tools to track subcontractor performance must go beyond simple data entry. In modern construction management, the tool must provide logic, automation, and intelligent alerts.
For managers who need the customizability of a spreadsheet but require the power of a dedicated application, Quadratic offers a unique solution. By allowing users to write logic in Python, it enables the creation of dashboards that actually drive decision-making rather than just recording history. If you are tired of fixing broken formulas or waiting for rigid software to update, load your contractor logs into Quadratic and see how programmable logic can automate your risk detection.
Use Quadratic to track subcontractor performance
- Automate risk detection: Move beyond manual reviews by using Python to automatically calculate deviations in planned vs. actual volumes, labor efficiency, and data quality as new logs come in.
- Generate proactive alerts: Configure custom logic in Python to instantly flag critical issues like significant volume deficits or declining labor efficiency, transforming raw data into actionable "risk status" alerts.
- Improve data integrity: Automatically identify and highlight missing or incomplete subcontractor data submissions, allowing you to address reporting issues immediately.
- Build custom dashboards: Create flexible, real-time dashboards that prioritize issues, showing only the subcontractors or work types requiring immediate attention, without the rigidity of traditional software.
- Eliminate formula fatigue: Replace brittle spreadsheet formulas with robust Python scripts directly in cells, ensuring your complex risk models are accurate, auditable, and won't break with accidental edits.
Ready to build a smarter system for monitoring your project's health? Try Quadratic.