Analyzing GA4 default channel grouping performance
This template centralizes channel performance analytics in a comprehensive two-sheet system, designed to streamline data analysis outside of the standard analytics interface. It enables robust period-over-period analysis for GA4 default channel groupings, allowing users to assess growth or regression over specific timeframes.
The dashboard automatically identifies top-performing channels and significant declines by processing raw datasets. It aggregates granular source data into high-level channel definitions, providing a clear view of performance. Users can visualize critical metrics—including engagement, conversion, and user acquisition—to derive actionable insights from their traffic data, which can inform the development of a marketing funnel template.
Raw data structure and inputs
The "Raw Channel Data" sheet acts as the primary data source for the entire dashboard. It contains approximately 29,000 rows of channel metrics, serving as the foundation for the Python-driven analysis.
- Dimensions: The dataset includes key dimensions such as Primary Channel Group and Source to allow for both high-level and granular filtering.
- Performance Metrics: Essential metrics including Total Users, New Users, and Engagement Time Per User are tracked to measure traffic quality.
- Conversion Data: The structure includes specific columns for Key Events and User Key Event Rate to monitor conversion performance.
Dashboard configuration and interaction
Users configure the analysis via a control panel located in cells H1:J10 on the dashboard sheet. This section allows for the selection of a primary date range to define the current period for analysis.
- Comparison Mode: A boolean checkbox at cell H6 enables or disables the comparison feature.
- Conditional Logic: Toggling the checkbox triggers conditional Python logic. When checked, the template activates secondary data pipelines to process historical data; when unchecked, it focuses solely on the primary date range.
Python-driven metric processing
The template leverages Quadratic’s native Python integration, which includes a python chart generator, to filter, aggregate, and compare data dynamically based on user inputs.
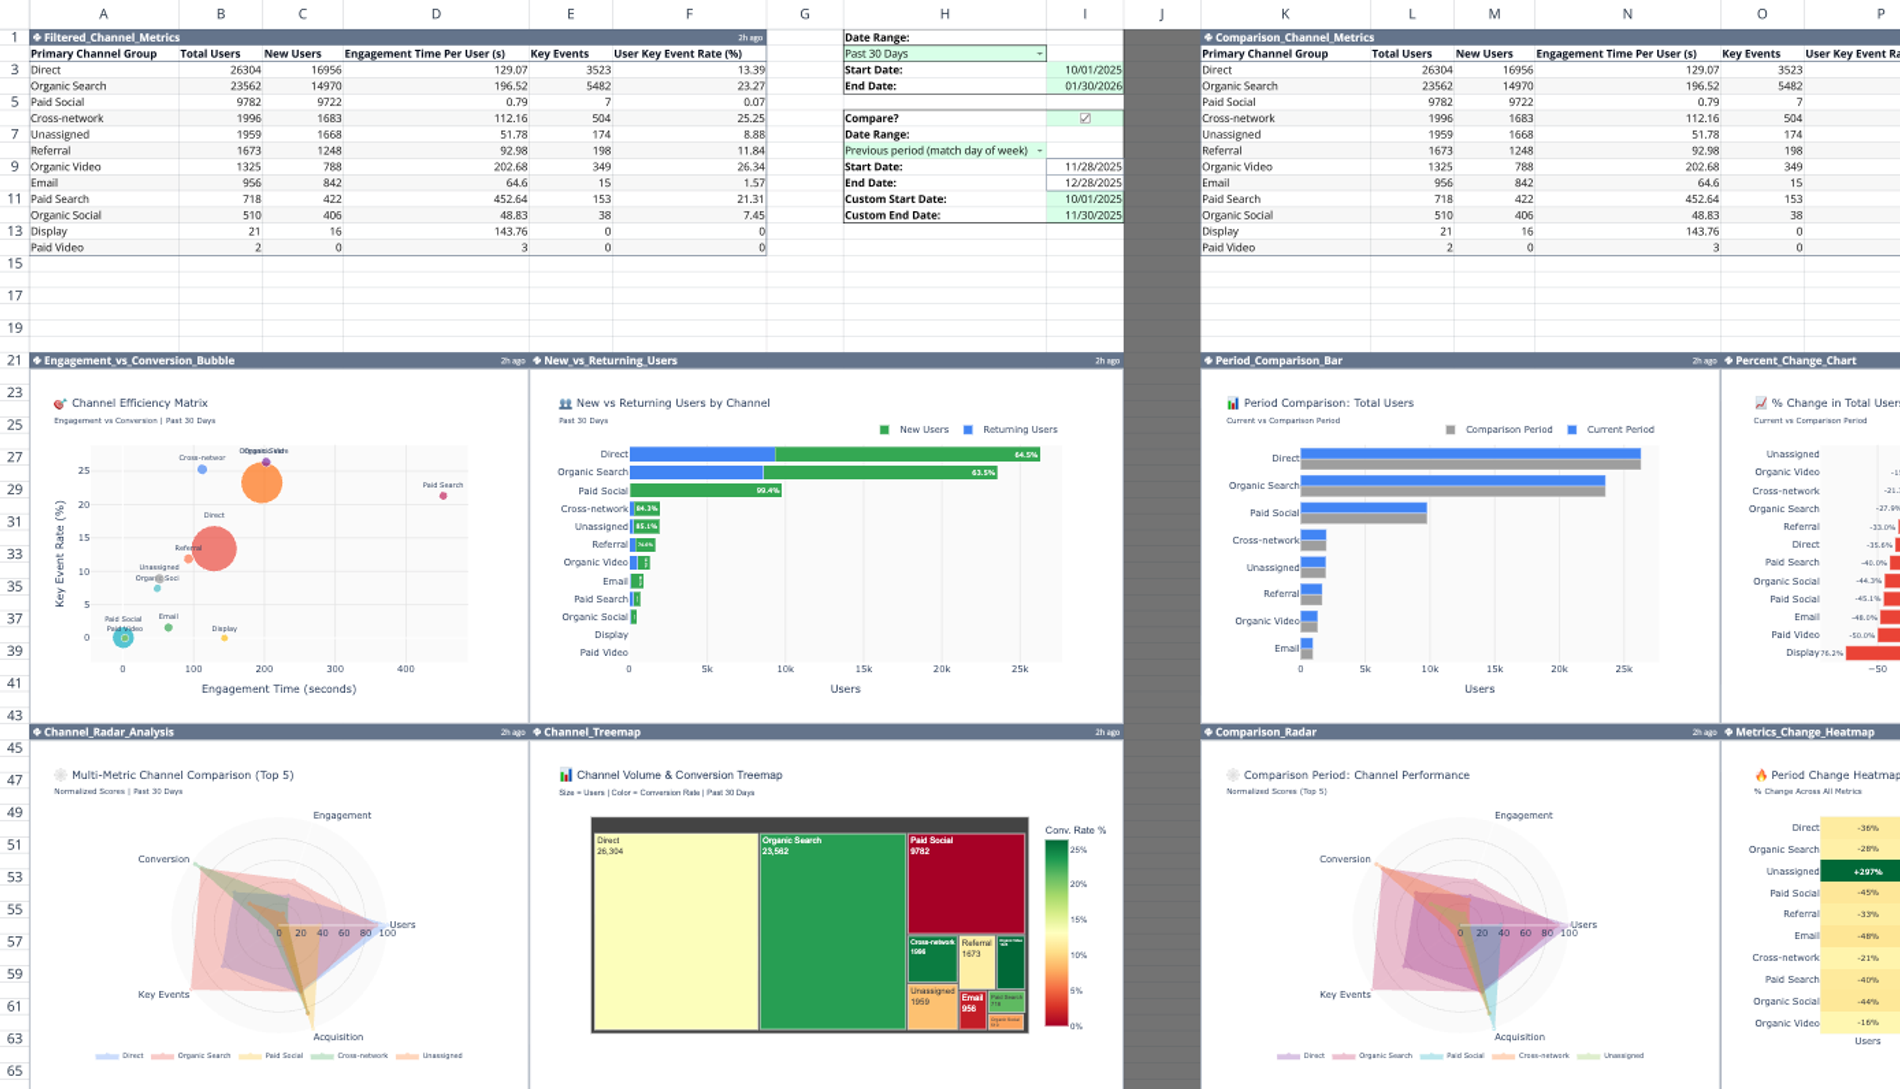
- Filtered_Channel_Metrics (A1:F14): Aggregates data for the primary period, grouping metrics by channel.
- Comparison_Channel_Metrics (K1:P14): Processes data for the secondary period to establish a baseline for comparison.
- Period_Difference (T1:AD14): Calculates the absolute and percentage deltas between the two periods, computing changes for users, new users, engagement time, and event rates.
- Period_Insights (R1:R19): Programmatically generates text-based summaries that identify the biggest winners and losers, highlighting significant growth or drop-offs in specific channels.
Visualizing channel and source metrics
The dashboard utilizes Plotly to render interactive marketing data visualizations that help interpret the tabular data.
- Engagement_vs_Conversion_Bubble: Plots user engagement against conversion rates to identify high-quality traffic sources.
- Channel_Treemap: Visualizes the relative size and volume of GA4 default channel groups.
- Channel_Radar_Analysis: Offers multi-dimensional comparisons of channel attributes to spot strengths and weaknesses.
- Period_Comparison_Bar: Compares metric volume between the selected date ranges to visualize scale changes.
- Metrics_Change_Heatmap: Highlights significant shifts in performance, making it easier to spot outliers and trends.
Who this GA4 default channel grouping template is for
This template is designed for data professionals and marketers who require flexible, code-based analysis of their analytics data.
- Marketing analysts tracking default channel group GA4 performance metrics.
- Data scientists needing pre-built Python pipelines for GA4 cross-network default channel group definition analysis.
- Agencies reporting on GA4 default channel groupings to clients who require custom period comparisons.
- Performance marketers comparing acquisition campaigns across time periods to validate strategy adjustments.
Use Quadratic to analyze GA4 default channel grouping performance
- Centralize GA4 channel performance data in a comprehensive two-sheet system.
- Conduct robust period-over-period analysis to assess channel growth or regression.
- Automatically identify top-performing channels and significant declines using Python-driven logic.
- Visualize engagement, conversion, and user acquisition metrics with interactive Plotly charts.
- Generate programmatic text summaries highlighting channel winners and losers for quick insights.
Get started (2 minutes)
- Connect Google Analytics (GA4) in Quadratic (one-time setup via Google Cloud)
- Open the template and refresh / run the connection table to pull in your data
- On the dashboard, select a date range (7 / 30 / 90 days or custom)
- (Optional) Toggle Comparison Mode to compare against a previous period
Once connected, you can also set up a scheduled task to refresh your GA4 data automatically.
Related templates
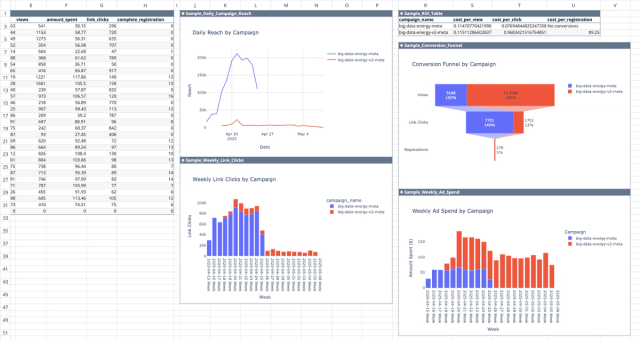
Meta Ads API Analytics Template
Get better insights from your Facebook ad campaigns with direct integration with the Meta Ads API.
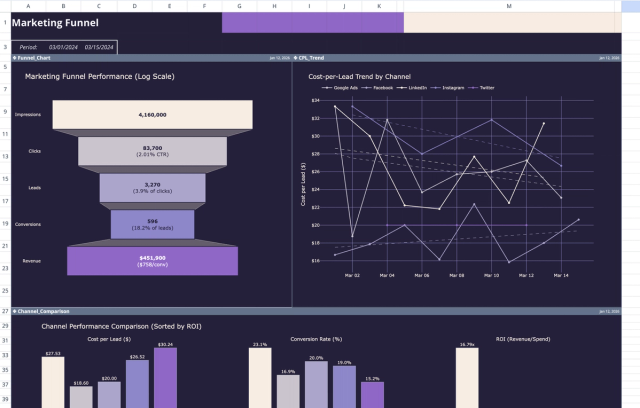
Marketing Funnel Template: Analytics & ROI Dashboard
Analyze marketing performance data through interactive charts and a detailed report.
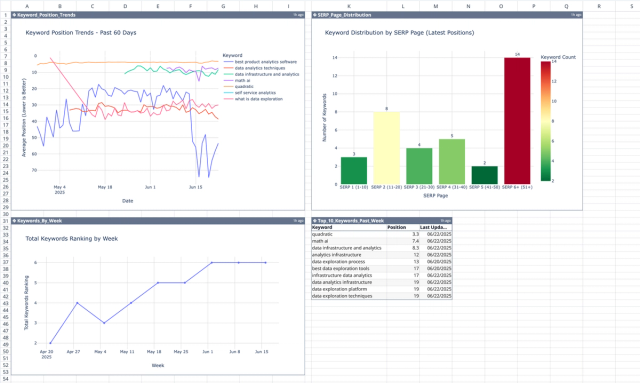
SEO Keyword Tracking Template
Track the organic position of your target keywords for a more robust content creation strategy.