
Every month starts with the best intentions. You sit down, check your income, and run the numbers through a standard 50 30 20 calculator. You determine exactly how much should go toward rent, how much is allocated for dining out, and what needs to hit your savings account. But by the 15th of the month, that plan usually falls apart. You have swiped your card dozens of times, and you have no idea if you are still within the 30% "wants" bucket or if you have already drifted into your savings.
The problem isn't the rule itself; it is the tools we use to track it. Most calculators are static planning tools. They tell you what you should spend based on your income, but they are completely disconnected from what you actually spend. They require you to manually export bank statements, categorize every line item, and update a spreadsheet by hand—a friction-heavy process that leads most people to abandon their budget entirely.
To solve this, users are turning to Quadratic to build a "living" 50 30 20 calculator. By combining the familiarity of a spreadsheet with the power of Python and SQL, you can create an automated budget system that connects directly to your transaction data, automates the categorization of expenses, and alerts you the moment you drift off track.
What is the 50/30/20 rule? (and why static calculators fail)
Before diving into the technical workflow, it is helpful to define the framework to understand why standard tools struggle to support it. The 50/30/20 rule is a popular budgeting guideline that divides your after-tax income into three distinct buckets:
- Needs (50%): These are your essential expenses that you cannot avoid, such as rent or mortgage payments, groceries, utilities, and insurance.
- Wants (30%): This covers lifestyle choices and discretionary spending, including dining out, streaming subscriptions, hobbies, and entertainment.
- Savings/Debt (20%): This portion is dedicated to your future financial health, covering retirement contributions, emergency fund building, and extra debt payments.
A typical 50/30/20 rule calculator works well for the input side of the equation. You type in your monthly take-home pay of $5,000, and it tells you that you have $1,500 for "wants." However, that number is useless if you don't know your current spending status. A static calculator ignores the output—your transaction history. This forces you to bridge the gap between your ideal budget and your real bank account manually, which is where the system usually breaks down.
Building a "living" calculator in Quadratic
To make the 50/30/20 method work in the real world, you need a workspace that can handle data ingestion and logic, not just static cells. A standard spreadsheet often breaks when you try to paste in new CSVs or write complex formulas to sort transactions.
In Quadratic, you can build a workflow that treats your budget as a data pipeline. The process involves three main stages: syncing actual data, applying logic-based categorization to sort needs from wants, and visualizing the "drift" between your plan and reality.
Step 1: Syncing transactions (beyond data entry)
The first step in building a dynamic 50 30 20 budget calculator is eliminating manual data entry. In a traditional setup, you might spend an hour typing in receipts or copy-pasting rows from Excel. In Quadratic, you can import transaction data directly.
Users can drag and drop CSV files from their bank or use Python to connect directly to financial APIs or databases. Once the data is in the grid, it serves as the "source of truth." Because Quadratic supports infinite scrolling and large datasets, you don't have to worry about running out of space or breaking your formulas when you add next month's data. This creates a dynamic foundation where the budget calculator 50 30 20 logic updates automatically whenever new transaction data arrives.
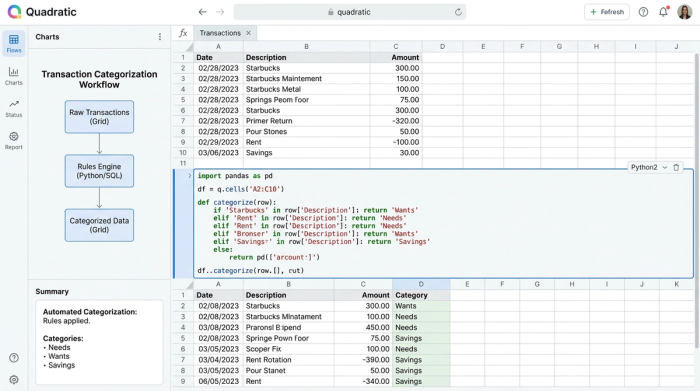
Step 2: Automating categorization logic
The biggest bottleneck in budgeting is categorization. Deciding whether a trip to Target was a "need" (groceries) or a "want" (new decor) for every single transaction is tedious. Most family budget apps try to do this for you using "black box" AI, but they often get it wrong, labeling your work lunch as a grocery expense or your utility bill as a subscription.
In Quadratic, you have full control over this categorization logic using SQL or Python directly in the spreadsheet. You can write a query that maps specific merchants to the correct 50/30/20 bucket automatically. For example, you can write a simple Python script or SQL query that states:
- If the merchant name contains "Netflix" or "Spotify," categorize as "Wants."
- If the merchant name contains "PG&E" or "Water Dept," categorize as "Needs."
- If the merchant name contains "Vanguard," categorize as "Savings."
This allows you to build a personalized rules engine. If you consider your morning coffee a non-negotiable "Need," you code it that way. This automation ensures that your 50/30/20 rule calculator is always reflecting your specific financial philosophy without requiring you to manually sort rows every week.
Step 3: Calculating the split vs. the reality
Once your data is synced and categorized, the next step is the comparison. You need to see how your actual spending stacks up against the targets you set.
Using standard spreadsheet formulas or SQL aggregation, you can sum up the total spending for the current month by category. You can then create a summary view that places your "Target" numbers (the output of your planning calculation) side-by-side with your "Actuals."
For instance, if your target for "Wants" is $1,000, but your SQL query shows you have already spent $950 by the 20th of the month, the comparison is immediate and undeniable. This transforms the tool from a passive 50/30/20 budget calculator into an active monitoring system.
The missing link: monitoring "drift" and alerts
The most powerful aspect of this workflow is the ability to monitor "drift." A budget is rarely a pass/fail exam; it is a course correction exercise. If you wait until the end of the month to see you overspent, it is too late to fix it.
In Quadratic, users can set up conditional formatting or Python-based alerts to visualize this drift in real-time. You can configure a cell to turn yellow when your "Wants" category hits 80% of its limit, and red when it exceeds 100%.
Imagine logging in on the 15th and seeing that your "Needs" are stable at 50%, but your "Wants" are already at 28% thanks to your weekly spending tracker. The visual alert prompts you to rebalance immediately—perhaps you decide to cook at home for the rest of the week to stay under the 30% cap. This feedback loop is what makes the calculator effective, turning data into a behavioral change.
Flexibility: when the 50/30/20 rule doesn't fit
Financial advice is not one-size-fits-all. In high cost-of-living cities, spending only 50% of income on necessities might be impossible due to rent prices. You might need a 60/20/20 split, or perhaps you are aggressively paying down debt and want a 50/10/40 split.
Static templates often break when you try to change the underlying ratios. Because you are building this logic in Quadratic, changing the parameters of your 50 20 30 calculator is as simple as updating a single variable. The entire pipeline—from the target calculation to the drift alerts—updates instantly to reflect your new goals. This flexibility allows the tool to grow with you as your income or financial priorities shift.
Conclusion
A 50 30 20 calculator is only useful if it reflects reality. If your tool only handles the planning phase, you are missing the most critical part of financial management: the execution. By building this workflow in Quadratic, you move from passive planning to active tracking. You gain the ability to sync real data, automate the tedious work of categorization, and see exactly where you stand before the month is over. It turns a rigid financial rule into a living system that helps you actually hit your goals.
Use Quadratic to build a living 50/30/20 budget calculator
- Connect directly to bank transaction data via CSVs or APIs for a real-time view of your finances.
- Automate expense categorization with custom Python or SQL logic, ensuring accurate tracking of needs, wants, and savings.
- Monitor your actual spending against 50/30/20 targets with dynamic visualizations and alerts that highlight budget "drift" instantly.
- Easily customize and adapt your budget ratios (e.g., 60/20/20) without breaking your system, making it suitable for evolving financial goals.
- Eliminate manual data entry and tedious spreadsheet updates, transforming your budget from a static plan into an active monitoring system.
Start actively tracking your budget today. Try Quadratic