Table of contents
Introduction: The End of the Static Spreadsheet
For many finance professionals, the "month-end close" is less of a process and more of a rescue mission. It usually involves exporting CSVs from a bank or accounting platform, pasting them into a master spreadsheet, checking for broken reference links, and manually categorizing hundreds of line items, a process often simplified by automated bank reconciliation. By the time the report is ready for the board, the data is two weeks old, and the strategic window to correct course has already closed.
This friction exists because traditional spreadsheets are static. They wait for you to feed them data. To achieve true financial agility, modern teams are shifting toward an automated budget, leveraging powerful spreadsheet automation. This is not simply a digital file hosted in the cloud; it is a programmable system where data flows, categorizes itself, and generates reports without manual intervention.
The solution lies in bridging the gap between the flexibility of a spreadsheet and the power of a database. By using a tool like Quadratic, which leverages the benefits of integrating Python and SQL for financial analysis directly into the grid, finance leads can build an automated budget that behaves like a custom application. This approach eliminates the manual drudgery of the close process, allowing finance teams to focus on analysis rather than data entry.
Why Modern Finance Needs "Rolling" Agility
The industry is moving away from the static annual budget—a document often obsolete by the end of the first quarter—toward more agile rolling forecasts and sophisticated FP&A modeling. While this methodology is superior, it is difficult to execute in standard spreadsheets due to the complexity of the formulas required.
This shift is particularly critical in the nonprofit sector. The benefits of automated budgeting and reporting for nonprofits go beyond mere convenience; they are often a matter of compliance and donor retention. Donors and grantmakers demand rigorous transparency regarding how funds are utilized, specifically the ratio between program costs and administrative overhead, necessitating adherence to nonprofit cost allocation best practices. In a static spreadsheet, calculating these ratios requires complex tagging and manual pivot tables every month. If a transaction is missed or mislabeled, the organization risks misreporting to its board or donors.
While a standard off-the-shelf automated budget app might handle basic expense tracking, these tools often lack the nuance required for fund accounting. They may not allow you to split a single invoice across three different grants or handle complex overhead allocation rules. This leaves finance professionals stuck between two extremes: rigid software that doesn't fit their workflow, or flexible spreadsheets that require too much manual labor.
Step 1: Automating Data Ingestion and Categorization
The first step in building a robust system in Quadratic is removing the manual copy-paste loop. Instead of downloading CSVs, a user can connect their budget directly to the data source, such as a PostgreSQL database, a data warehouse, or an API connected to their ledger.
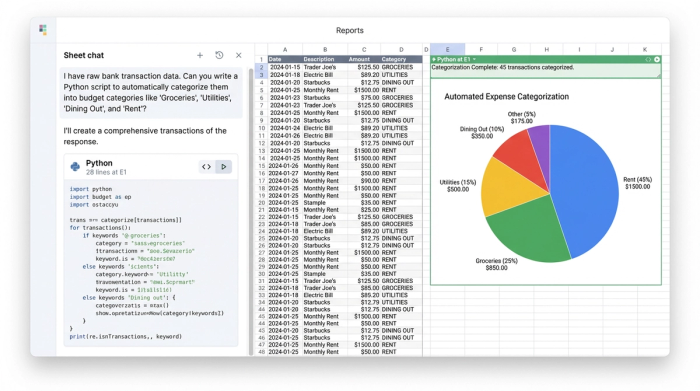
Once the data is in the sheet, the real power of how AI automates budgeting comes into play. In a traditional spreadsheet, categorizing expenses involves scanning rows and manually selecting a category from a dropdown menu. in Quadratic, you can use Python (or SQL) to automate this logic entirely.
For example, a nonprofit finance lead can write a short script that scans the "Vendor" and "Description" columns. The script can be programmed to instantly route any transaction from specific vendors to "Program Costs" or "Marketing," while flagging ambiguous items for review. This logic happens the moment the data hits the ledger. By using Python libraries or even asking Quadratic's built-in AI to write the categorization script for you, you transform a manual data entry task into an automated flow. The result is a ledger that is 90% categorized the moment you open the file.
Step 2: Building the Rolling Forecast Logic
Once the actuals are ingested and categorized, the next step is automating the forward-looking view, often initiated with a robust financial forecast template. A rolling budget requires the forecast to adjust dynamically based on what happened in the previous month.
In Excel, this often results in a fragile chain of VLOOKUP or INDEX/MATCH formulas. If one cell is deleted, the entire forecast breaks (the dreaded #REF! error). In Quadratic, you can build this logic using Python variables and dataframes. You can set up a rule: "If 'Actuals' for January are $5,000 under budget, automatically roll that $5,000 into the 'Unallocated' budget for the remaining months."
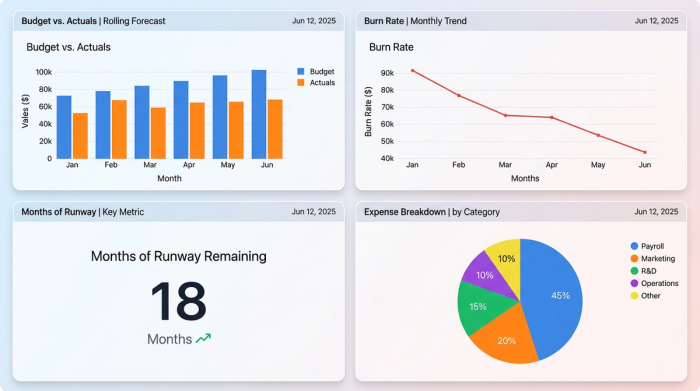
This logic ensures that the budget remains a living document. It also facilitates board-ready reporting. Because the data transformation happens in code, you can generate clean, aggregated tables specifically for visualization. You can create dynamic charts that visualize the "burn rate" or "months of runway remaining" that update automatically as expenses accrue. The finance lead doesn't just see a wall of numbers; they see a dashboard that answers strategic questions instantly, aided by effective financial data visualization.
Step 3: The "Killer Feature"—Automated Alerts for Overruns
Perhaps the most significant advantage of a programmable spreadsheet over a standard file is the ability to be proactive. Most competitors in the budgeting space focus on reporting—telling you what happened in the past. A truly automated system should leverage early warning systems for proactive financial management, telling you what is happening right now.
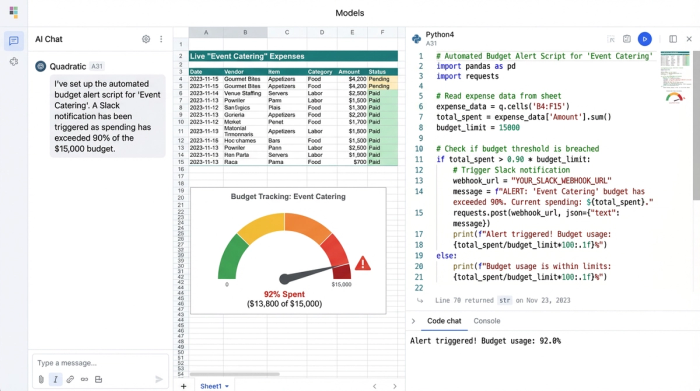
In Quadratic, users can set up automated alerts using Python scripts. For instance, a user can define a budget cap for "Event Catering." The script runs daily, sums the actuals for that category, and checks them against the cap. If the spend exceeds 90% of the budget, the script can trigger a webhook to send a Slack message or an email to the finance director.
This capability changes the nature of financial management. It moves the finance team from a reactive posture—discovering an overrun thirty days later during the month-end close—to a proactive one. They can intervene immediately, pausing spend or reallocating funds before the fiscal damage is permanent. This level of interactivity is virtually impossible in legacy spreadsheets without complex VBA macros that are difficult to maintain.
Beyond Nonprofits: Who Else Needs Custom Automation?
While the nonprofit use case is compelling due to the complexity of fund accounting, the need for flexible, programmable budgeting extends to many other sectors where off-the-shelf tools fall short.
For example, logistics managers often struggle to find the best budget-friendly supply chain automation software for distribution centers. These professionals need to track inventory carrying costs and shipping variances that fluctuate daily—logic that requires the customizability of a spreadsheet but the data handling of a database.
Similarly, property managers dealing with multi-unit developments might look for a condo budgeting automation tool. They need to allocate maintenance fees across hundreds of units based on square footage or amenity usage, a calculation that is tedious in Excel but trivial with a Python loop.
Sales and marketing teams also benefit. A team looking for the best marketing budget allocation automation needs to track spend across dozens of channels, adjusting bids dynamically based on performance data. Agencies and service providers might use similar logic for proposal automation tools interactive budgeting cost estimation, allowing them to estimate project costs dynamically based on changing inputs like hours, materials, and contractor rates, often requiring detailed P&L analysis.
Justifying the Switch
Moving from a legacy process to a new tool often requires a business case. Whether you are trying to secure buy-in for a new finance platform or even how to justify budget for demo automation software, the core argument remains the same: the true cost of manual data entry in finance and delayed insights far exceeds the cost of the tool.
When a finance lead spends three days manually cleaning data, that is three days not spent on strategy and effective financial data analytics. When a broken formula causes a budget overrun to go unnoticed, the financial impact is direct. Quadratic positions itself not just as a better spreadsheet, but as a risk mitigation tool. It allows the finance team to build the reliability of an enterprise resource planning (ERP) system without the six-figure price tag or the year-long implementation cycle.
Conclusion: The Best of Both Worlds
For too long, finance professionals have had to choose between the freedom of a spreadsheet and the automation of specialized software. The former offered flexibility but demanded manual labor; the latter offered automation but demanded rigid adherence to someone else's workflow.
Quadratic removes this trade-off. By embedding the power of code into the familiar grid interface, it allows users to build an automated budget that is as unique as their organization. You can connect to live data, automate complex categorization logic, and set up proactive alerts that keep your team on track.
The era of the static, backward-looking spreadsheet is over. It is time to stop reporting on the past and start automating your future. We encourage you to explore Quadratic and see how a programmable grid can transform your financial planning from a monthly chore into a strategic asset.
Use Quadratic to build an automated budget
- Eliminate manual data entry by connecting directly to live data sources like databases and APIs for real-time transaction ingestion.
- Automate expense categorization with Python or SQL scripts, instantly tagging transactions for program costs, overhead, or specific grants.
- Build dynamic rolling forecasts that automatically adjust based on actuals, maintaining budget agility without fragile formulas.
- Set up proactive, real-time alerts to notify you via Slack or email when spending approaches budget limits, enabling immediate action.
- Handle complex fund accounting and custom allocation rules, such as splitting invoices across multiple grants, with programmable logic.
- Generate board-ready reports and dynamic dashboards that visualize key metrics like burn rate, updating automatically as data flows in.
Ready to transform your budget from a static document into a strategic asset? Try Quadratic.