Purpose of this financial forecast template
This template automates the creation of 12-month forward-looking projections by processing historical transaction data through Python. Instead of relying on manual cell references, it uses a script to calculate revenue, expenses, and net income, while simultaneously generating confidence intervals for scenario planning.
The primary goal is to streamline the transition from raw accounting ledgers to strategic business insights. By visualizing financial health through interactive Plotly charts rather than static grids, users can quickly assess cash flow trends and operational runway.
Template components and structure
The template is organized into three distinct sheets, creating a unidirectional data flow from input to visualization:
- Historical_Data sheet: Serves as the raw data input source containing a ledger of financial transactions.
- Forecast_Data sheet: Houses the Python logic that processes history into future projections.
- Dashboard sheet: Displays high-level metrics, cash balance inputs, and visualization widgets.
Historical data input
The Historical_Data sheet acts as the foundational dataset for the analysis. It contains a structured table of 30 historical transactions spanning from January through July 2023.
To ensure the Python script functions correctly, data is organized by the following columns:
- Date: The transaction date.
- Category: Broad classification (Revenue or Expense).
- Type: Specific sub-categories (e.g., Sales, Subscription, Salary, Marketing).
- Amount: The numerical value of the transaction.
- Description: Contextual notes regarding the entry.
Forecasting logic
The core processing engine is located in the Financial_Forecast Python code cell within the Forecast_Data sheet. This script ingests the historical ledger and generates a 12-month projection window covering August 2023 through July 2024.
The script outputs a comprehensive table containing:
- Key Financials: Month, Revenue, Expenses, and Net_Income.
- Confidence Intervals: Calculated 10% variance bands represented as Revenue_Lower/Upper and Expenses_Lower/Upper.
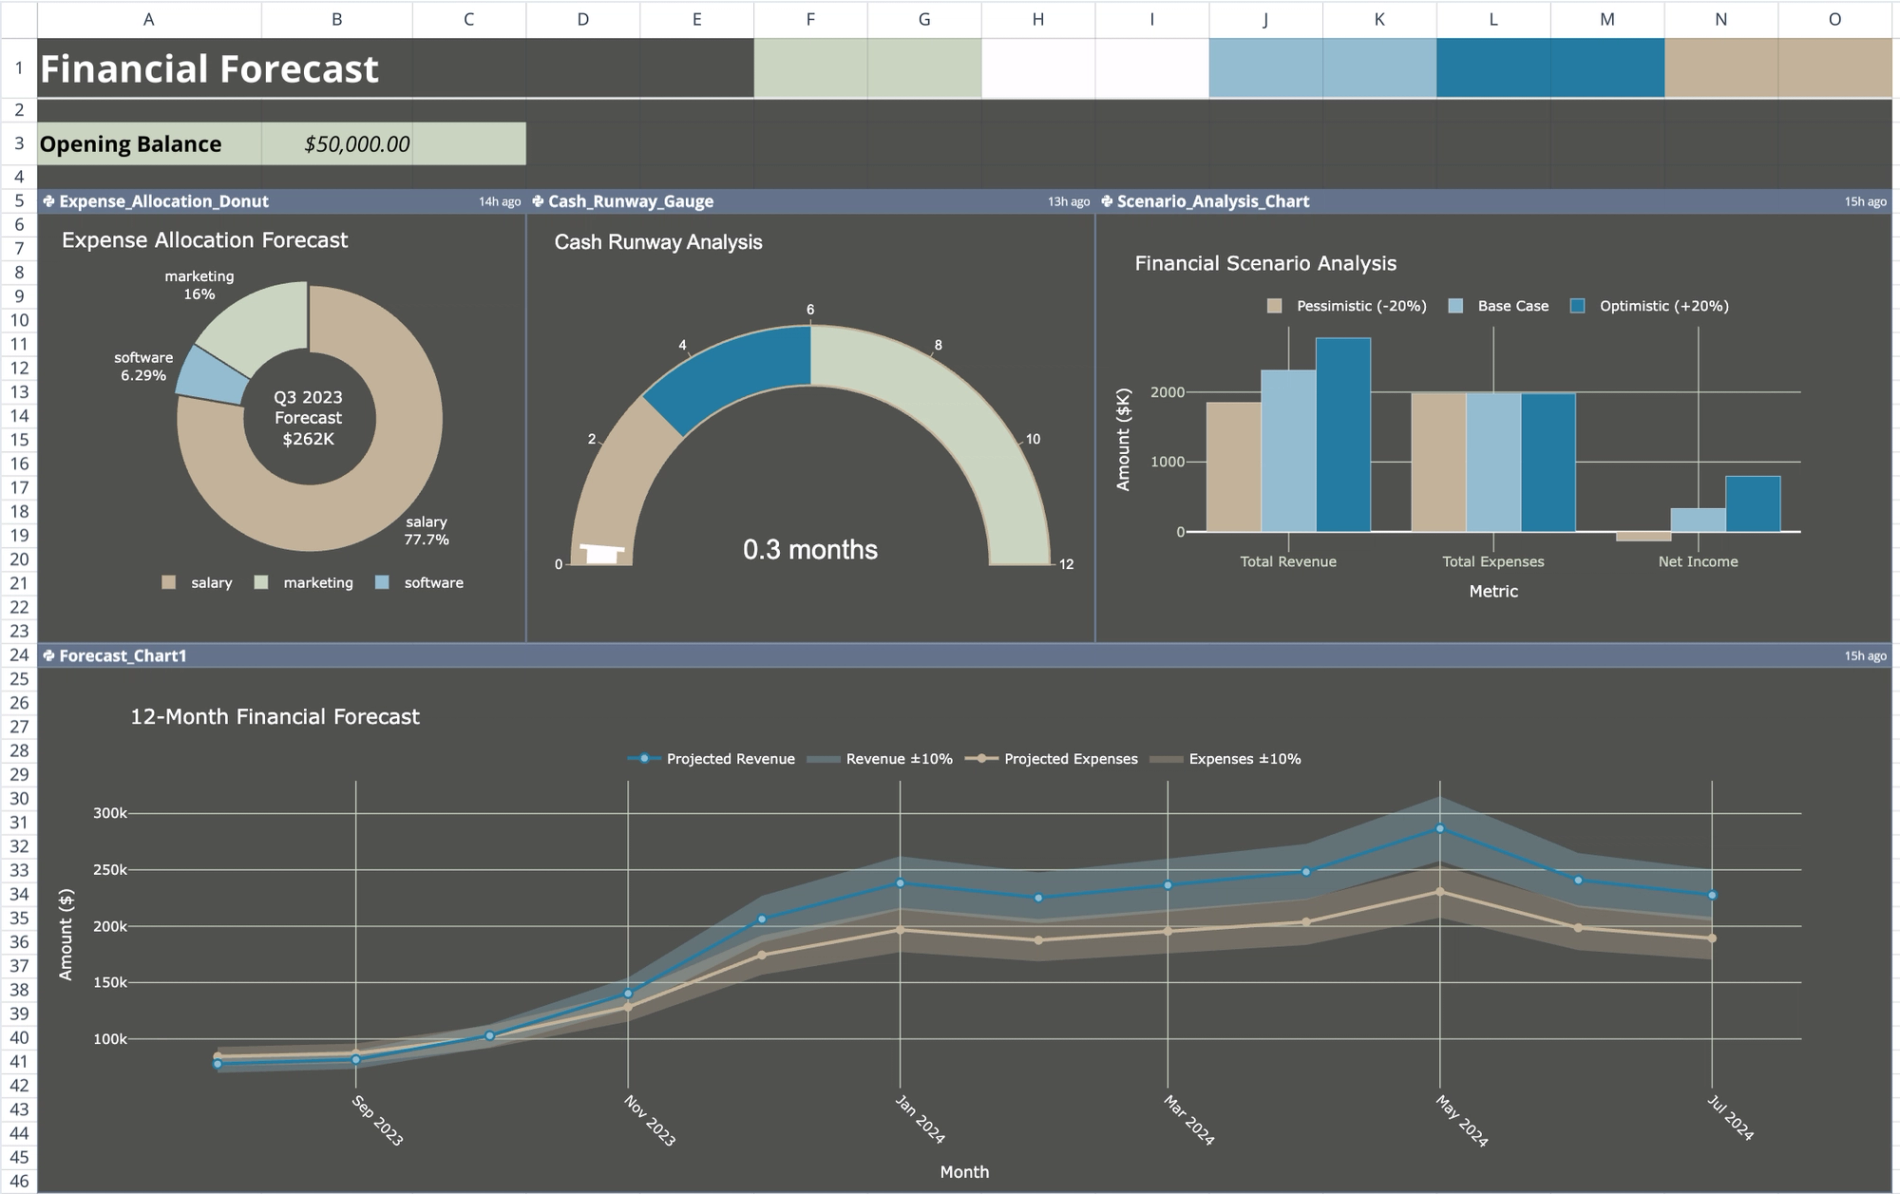
Key dashboard metrics and charts
The Dashboard sheet visualizes the processed data using six interactive Plotly charts, referencing data via Quadratic’s q.cells() function.
- Expense allocation donut: Visualizes the distribution of spending across specific categories, such as software, marketing, and operations.
- Cash runway gauge: Estimates the number of operational months remaining based on the opening balance and projected burn rate.
- Scenario analysis chart: Plots optimistic and pessimistic scenarios by visualizing the calculated confidence interval bounds.
- Cash flow waterfall: Illustrates cumulative changes in cash position month-over-month throughout the forecast period.
- Forecast accuracy chart: Compares predictive data against actual historicals where timelines overlap to validate model performance.
How to use the financial forecasting template
1. Input opening balance: Navigate to the Dashboard sheet and enter your current starting cash position in cell B3.
2. Update historical data: Go to the Historical_Data sheet and replace the sample rows with your actual business transactions, maintaining the existing column structure.
3. Run projections: The Python script in the Forecast_Data sheet will automatically ingest the new data to update the projection table.
4. Analyze scenarios: Review the Dashboard visuals to understand how changes in historical trends impact your future confidence intervals and cash runway.
Who this financial forecast template is for
- Startups requiring a flexible startup financial forecast template that adapts to new data without manual formula maintenance.
- Business planners needing a comprehensive business plan financial forecast template that includes automated scenario modeling.
- Analysts looking for a 3 year financial forecast template structure that can be easily extended or modified via Python.
- Small businesses moving away from rigid financial forecast template excel files toward automated, code-backed solutions.
Use Quadratic to Automate Financial Projections and Scenario Planning
- Automate 12-month forward-looking projections by processing historical transaction data through Python.
- Generate confidence intervals automatically for optimistic and pessimistic scenario planning.
- Visualize financial health, expense allocation, and cash runway with interactive Plotly charts.
- Update forecasts quickly by replacing historical data, eliminating manual formula adjustments.
- Extend or customize the forecasting logic and output tables directly using native Python.
Related templates
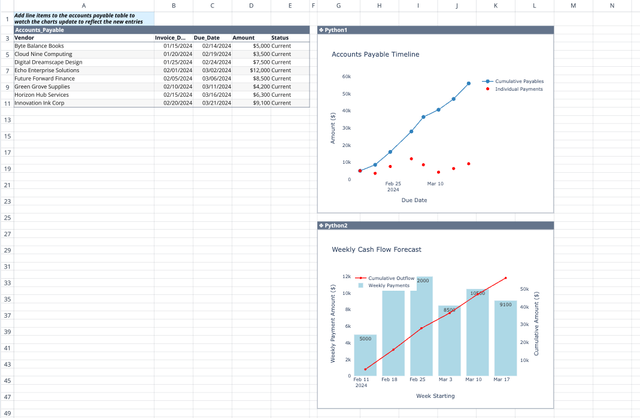
Accounts Payable Template
Get real-time visibility and insights into your payment obligations.
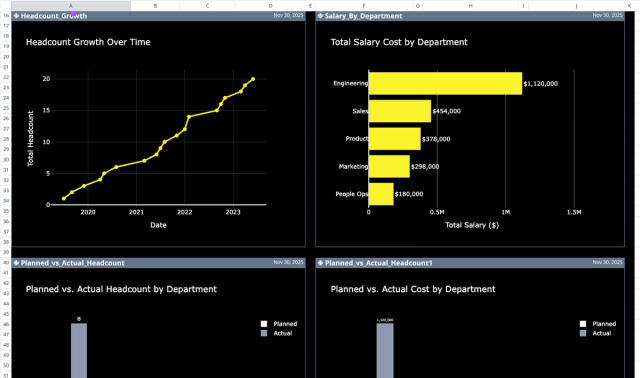
Headcount Planning Template: Variance & AI Insights
Plan and analyze employee headcount, costs, and departmental variances.

Lifetime Value (LTV) Calculator
Calculate and visualize customer lifetime value across different scenarios.