Template overview
This template provides a comprehensive, integrated 5-year financial projection designed specifically for early-stage SaaS companies, enabling thorough financial analysis. It comprises eight interconnected sheets driven by Python code, moving from raw assumptions to detailed financial statements and valuation metrics.
The model utilizes a driver-based financial modeling for SaaS startups approach. Instead of fragile cell references, Python scripts read from centralized data tables to generate outputs. Key components include:
- Centralized Assumptions: A single source of truth for all model inputs.
- Python-generated Models: Automated revenue and cost calculations.
- Three-statement Output: Integrated Income Statement, Cash Flow, and Balance Sheet.
- Analysis: DCF Valuation and multi-scenario planning.
Centralized assumptions
The "Assumptions" sheet acts as the control panel for the entire SaaS startup financial model. All downstream projections rely on the data entered here, ensuring consistency across the workbook.
General & funding
This section houses global metrics such as the corporate tax rate (defaulted to 25%), Weighted Average Cost of Capital (WACC at 12%), and terminal growth rate (3%). Users also define capital injection terms here, including Seed equity, Series A, and debt financing parameters. This structure supports driver-based financial modeling for early-stage saas startups by isolating capital drivers from operational logic.
Revenue drivers
Revenue inputs are broken down into four specific streams: SaaS Subscriptions, Professional Services, Training & Support, and Licensing Fees. Users input the Base Year 1 value for each stream and configure the expected year-over-year growth rates.
Cost drivers
Costs are categorized into fixed (OpEx) and variable (COGS) drivers. The table allows users to input growth rates for fixed costs and define percentage-of-revenue logic for variable costs.
Automated revenue and cost modeling
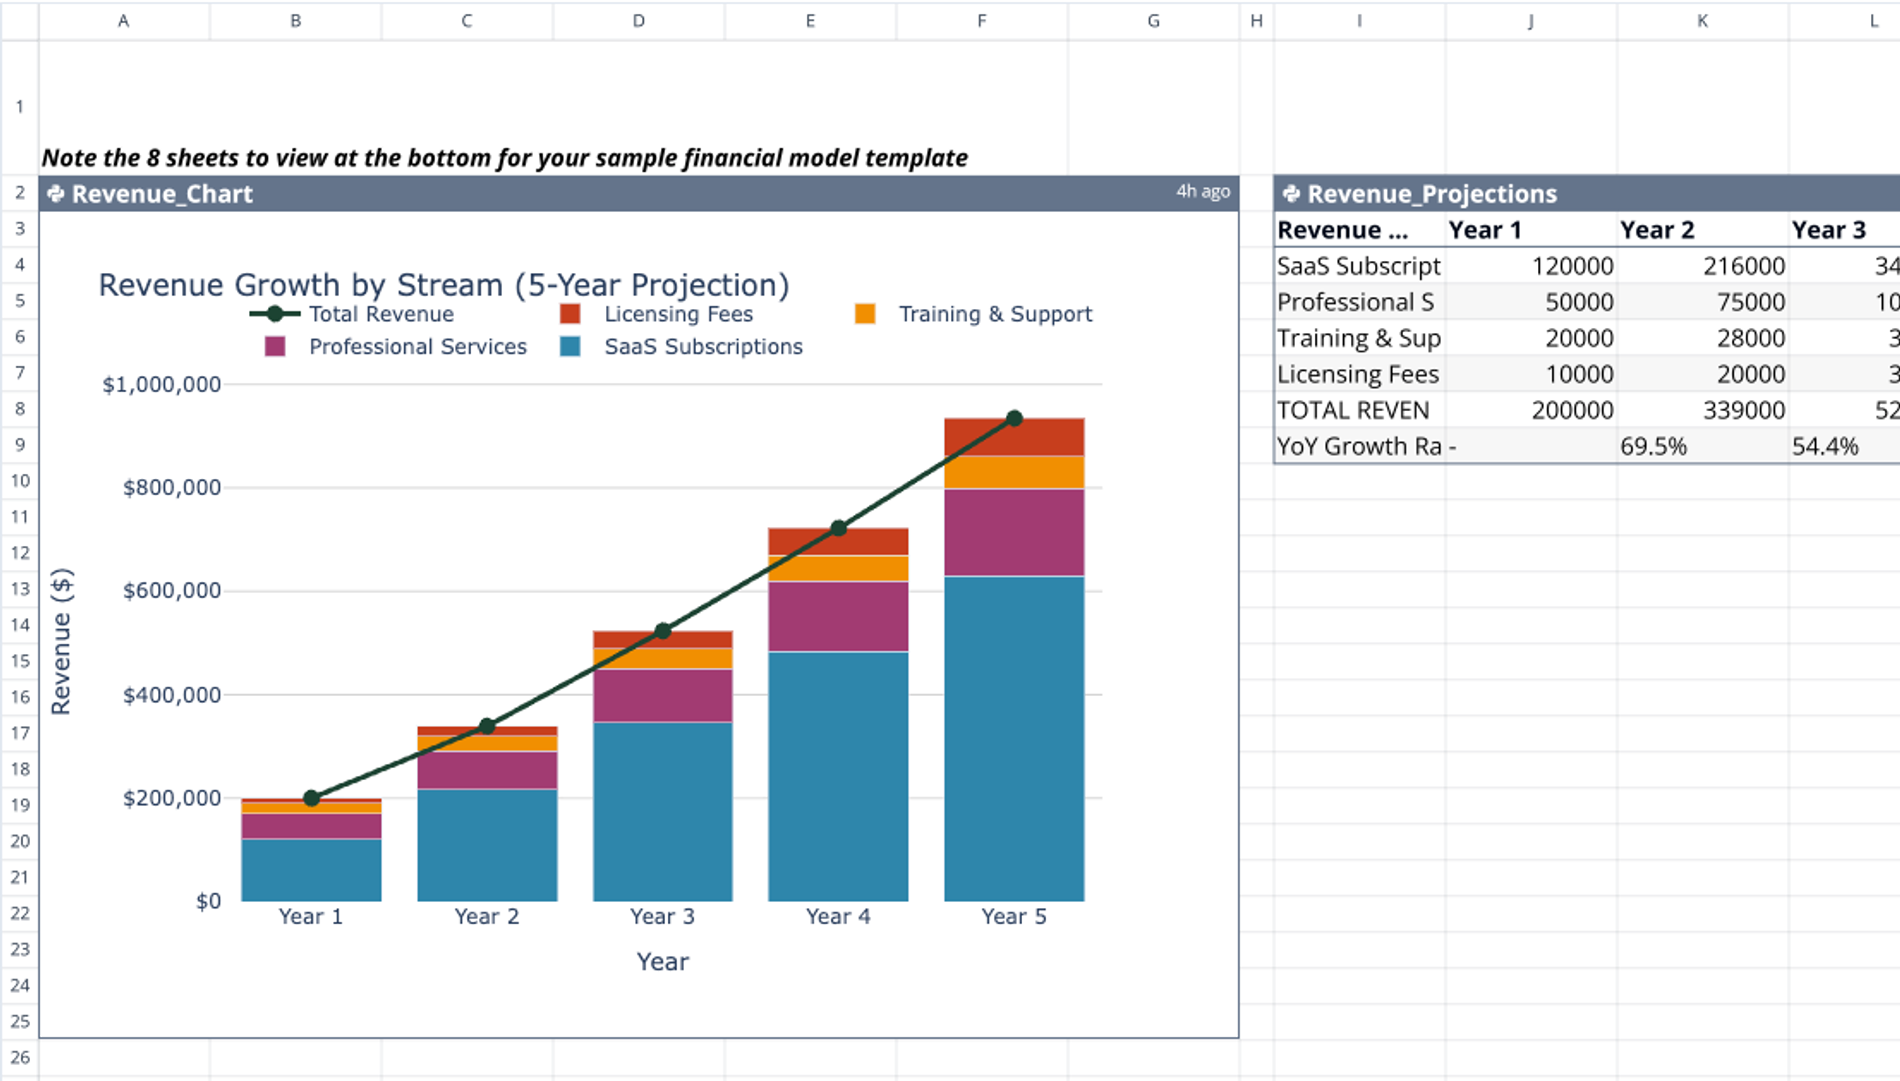
Revenue model sheet
A Python code cell in this sheet reads the Revenue_Assumptions table. It takes the Year 1 base values and compounds them by the defined growth rates to generate a Revenue_Projections dataframe for Years 1 through 5. A Plotly chart is included to dynamically visualize revenue growth over the projection period.
Cost model sheet
This sheet calculates expenses based on the logic defined in the assumptions:
- Variable Costs: COGS are calculated as percentages of revenue. For example, the template defaults Hosting to 15% and Support to 8% of relevant revenue streams.
- Fixed Costs: Growth rates are applied to operating expenses such as Salaries, Marketing, and R&D.
- Integration: The output is a clean Cost_Projections dataframe that feeds directly into the downstream financial statements.
Integrated financial statements
Income statement
This sheet aggregates data from the Revenue and Cost projections to compute Gross Profit and EBIT. Python logic automatically calculates Interest Expense based on debt schedules and applies tax rates only when Earnings Before Tax (EBT) is positive. A profitability chart tracks Net Income over the 5-year period.
Cash flow statement
The Cash Flow Statement is built using the indirect method, starting with Net Income. The code automatically adds back depreciation, adjusts for changes in working capital, subtracts Capital Expenditures (CapEx), and incorporates financing activities defined in the Funding Assumptions to determine the ending cash balance.
Balance sheet
The Balance Sheet constructs a 5-year view of Assets, Liabilities, and Equity. It tracks accumulated depreciation, monitors declining debt balances via repayment schedules, and accumulates Retained Earnings. This automated structure is an essential component of a complete financial model for SaaS startup planning.
Valuation and scenario analysis
DCF valuation
The Valuation sheet performs a Discounted Cash Flow (DCF) analysis. The calculation flow derives Net Operating Profit After Tax (NOPAT) from EBIT, calculates Free Cash Flow (FCF), and discounts these flows using the WACC defined in the assumptions. It applies the Gordon Growth formula to determine terminal value, sums these to find Enterprise Value, and subtracts net debt to arrive at Equity Value.
Scenario planning
The Scenarios sheet runs three distinct cases: Pessimistic, Base, and Optimistic. Python scripts apply percentage adjustments to revenue and costs while varying WACC and terminal growth rates. The output provides a side-by-side comparison of Year 5 metrics and valuation figures, allowing for rapid risk assessment, which can be further enhanced by a Monte Carlo simulation.
How to customize this template
Modifying drivers
To adapt the model, edit the data tables in the "Assumptions" sheet. Changing values here—such as tax rates, growth percentages, or starting capital—will instantly update the entire SaaS startup financial model template.
Adjusting Python logic
For deeper customization, users can access the Python cells using q.cells(). This allows for the modification of calculation rules, such as changing how COGS are calculated (e.g., switching from percentage-based to fixed) or adding new revenue logic for financial data analytics.
Extending projections
To extend the time horizon beyond 5 years, users can adjust the range in the Python scripts and add corresponding columns to the source tables in the Assumptions sheet. Additional cost categories can also be added to the tables and will be automatically picked up by the model provided the row structure remains consistent.
Use Quadratic to build a SaaS startup financial model
- Model 5-year financial projections for your SaaS startup using Python-driven logic.
- Control all inputs from a centralized assumptions sheet for consistency.
- Automate revenue and cost projections to feed integrated income, cash flow, and balance sheets.
- Run discounted cash flow (DCF) valuation and multi-scenario analyses for risk assessment.
- Customize calculation rules or extend projections directly within Python cells.
Related templates
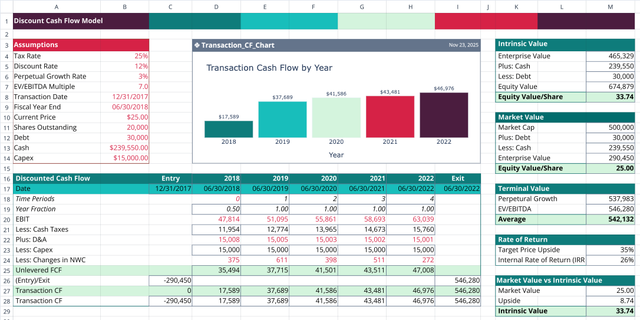
Discounted Cash Flow Model Template
Project cash flows, apply discount rates, and compare intrinsic value to market price.
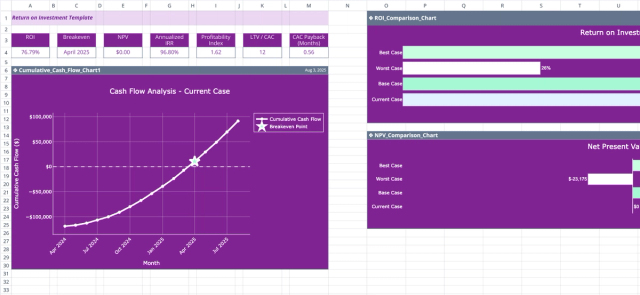
Return on Investment (ROI) Template
Transform your investment decisions with smart financial modeling.
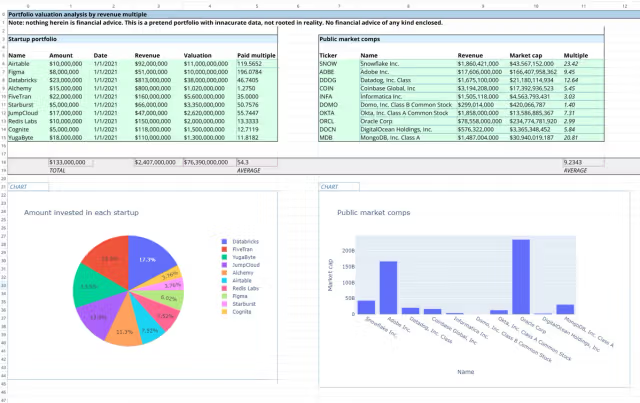
Startup Portfolio Tracking Template
Track a sample venture portfolio using Python and Formulas.