
Founders often face a moment of anxiety when staring at a blank spreadsheet. The immediate instinct is to search for a standard startup financial model template or a small business bookkeeping template, download a generic Excel file, and start plugging in numbers. But this approach usually fails the moment you need to change a core assumption. You change a growth rate in cell C4, and suddenly the reference in cell J98 breaks, returning a cascade of errors.
Financial modeling is not just an accounting exercise. It is your product roadmap translated into numbers and the primary tool for communicating viability to investors. A static grid cannot capture the volatility of early-stage ventures. Instead of relying on fragile templates, modern finance professionals are building "living" models. By using Quadratic, you can create a startup financial model that handles multi-year projections and fundraising scenarios dynamically. This approach combines the familiarity of a spreadsheet with the power of Python and an infinite canvas, ensuring your model adapts as fast as your business does.
The anatomy of a SaaS financial model
To build a robust financial model for SaaS startup viability, you need to satisfy the rigorous expectations of investors while maintaining enough flexibility for internal planning. A professional model requires three distinct but interconnected components.
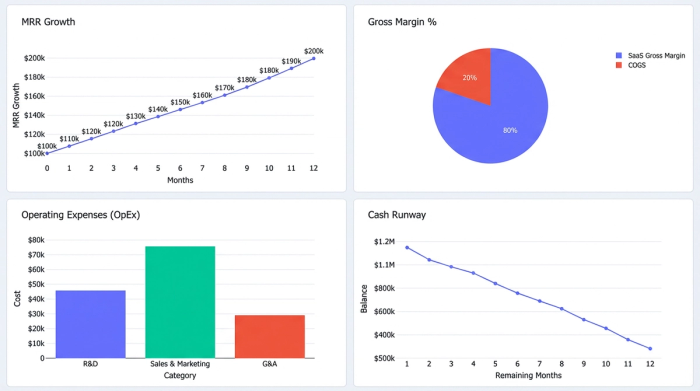
First, you need clear revenue logic. For a SaaS company, this means modeling subscription tiers, Monthly Recurring Revenue (MRR), Annual Recurring Revenue (ARR), and churn, all key components of a SaaS financial model. You cannot simply guess a top-line number; you must build it up from customer acquisition assumptions, often modeled using a sales funnel calculator.
Second, you must distinguish between Cost of Goods Sold (COGS) and Operating Expenses (OpEx). Hosting costs and customer support software usually fall under COGS, while engineering salaries, rent, and marketing spend fall under OpEx. This distinction is vital for calculating your gross margin, a key metric found in a profit and loss statement template that investors scrutinize closely.
Third, and perhaps most critically, is the cash flow statement. Startups die when they run out of cash, not when they run out of accrued revenue. You need a view that tracks actual cash in the bank, which can be facilitated by an operating cash flow calculator and reinforced by sound cash flow management strategies.
In traditional spreadsheets, these three components are often hidden in separate tabs, making it difficult to audit the flow of data. Quadratic changes this dynamic with its infinite canvas. You can place your revenue build, expense ledger, and cash flow statement side-by-side. This visibility allows you and your investors to trace the logic visually, moving from assumptions to bank balance without clicking through a maze of hidden sheets.
Moving beyond spreadsheets: driver-based modeling
The biggest risk in financial modeling for startups is hard-coding numbers into calculations. If you manually type "10%" into twelve different cells to represent growth, updating your plan requires twelve manual edits—and the risk of missing one is high.
The solution is driver-based planning. This method separates your assumptions (inputs) from your calculations (outputs). In a driver-based model, you identify the key variables that drive your business, such as Customer Acquisition Cost (CAC), headcount growth, and pricing tiers.
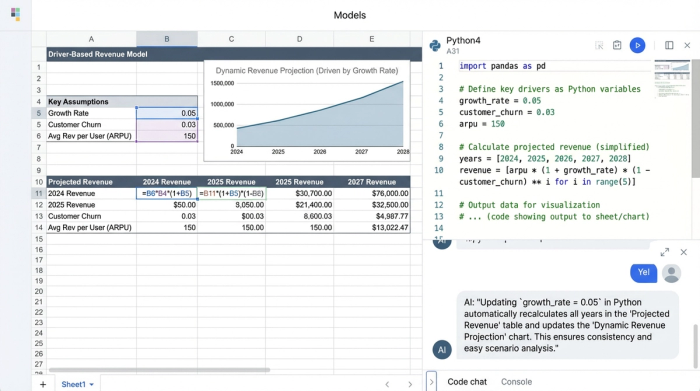
This is where driver-based financial modeling for SaaS startups becomes powerful in Quadratic. Instead of burying these drivers in cells, you can use Python code blocks to define them as variables. For example, you might write a simple line of code like growth_rate = 0.05.
Once this variable is defined, you can use it throughout your spreadsheet. If you need to adjust your projections, you update the variable in one place, and the entire multi-year projection recalculates automatically. When comparing driver-based financial models vs spreadsheets for small startups, the difference is stability. Standard spreadsheets rely on fragile cell referencing (like $A$1), which breaks easily if rows are added or deleted. Python variables in Quadratic remain stable regardless of where the data moves on the grid.
Calculating critical metrics: burn rate and runway
For early-stage founders, specifically those practicing startup booted financial modeling where every dollar counts, two metrics matter more than anything else: burn rate and runway.
Burn rate is the speed at which you are spending cash. Gross burn is your total monthly spending, while net burn is your spending minus your incoming revenue. Runway is your "time to death"—the number of months you can survive before your cash balance hits zero.
Calculating these in a standard spreadsheet often involves nested formulas that are hard to read. In Quadratic, the workflow is transparent and auditable.
1. Pull your total expenses from your OpEx section, which can be managed with a business expense tracker.
2. Pull your current bank balance.
3. Use a Python formula to calculate the result.
Instead of a cryptic Excel formula like =SUM(B2:B50)/D12, you can write a clear Python equation: runway_months = current_cash / net_burn. This clarity is essential when you are in a board meeting or an investor pitch. If someone asks how the number was derived, the logic is written in plain English, not hidden in a cell reference.
Scenario planning for fundraising rounds
Investors rarely accept a model at face value. During a pitch, they will ask "what-if" questions, making robust scenario analysis crucial.
In a traditional environment, answering these questions often requires creating a "Save As... Version 2" file or building complex, fragile data tables. This friction slows down the negotiation process.
Quadratic allows you to build a dynamic startup financial model template that responds instantly to these inputs. You can set up a "Funding Input" cell linked to your Python variables. By toggling the investment amount in that single cell, the model instantly recalculates your hiring plan, marketing budget, and runway.
This capability transforms your model from a static report into a strategic tool. You can use it to identify exactly when you need to raise your Series A round based on the forecasted cash-out date, giving you the confidence to negotiate from a position of strength, backed by financial data analytics.
Visualizing viability for investors
When you are looking at the top 5 tools for startup valuation and financial modeling, the ability to visualize data is often the deciding factor. Investors do not have time to audit every single cell in a massive grid. They need to see trend lines that validate your narrative.
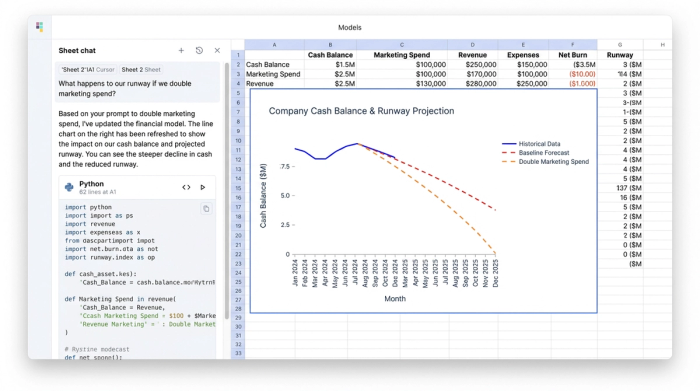
A wall of numbers is uninspiring. To capture attention, you need to visualize the relationship between your revenue and your expenses over time. In Quadratic, you can plot your cash balance and burn rate directly on the infinite canvas, right next to your "Drivers" section.
This setup enables powerful visual storytelling. Imagine you are in a pitch meeting. An investor asks what happens if you double your marketing spend. You change the variable in the driver section, and the "Cash Balance" graph curve updates in real-time. This immediate visual feedback demonstrates that you have a firm grasp on the levers of your business. It turns a monologue into a collaborative conversation about the future of the venture.
Common mistakes to avoid
Even with the best tools, logic errors can undermine your credibility. Here are a few common pitfalls to watch for, among other common financial forecasting mistakes.
- Confusing bookings with revenue: Cash bookings are what you invoice; revenue is what you recognize over time. Confusing the two can lead to severe cash flow misunderstandings.
- Underestimating one-time costs: It is easy to model recurring salaries, but founders often forget legal fees, hardware setups, and software implementation costs. Always add a buffer for "unforeseen" OpEx.
- Over-optimizing early models: Do not try to predict five years of data with pinpoint accuracy. Keep the model simple, flexible, and focused on the drivers that actually move the needle.
Conclusion
A great startup financial model is not just a compliance document you create to satisfy due diligence. It is a decision-making engine that guides your hiring, spending, and strategy. By moving away from brittle, static grids and embracing a living, driver-based approach, you gain control over your financial narrative.
Stop struggling with broken formulas and disjointed spreadsheets. Build a model that gives investors confidence and gives you clarity. With Quadratic, you can integrate your data, logic, and visualization in one infinite workspace, ensuring you are always ready to plan, project, and fund your venture.
Try Quadratic, the AI spreadsheet that does your work for you
Use Quadratic to build and manage your startup financial model
- Build dynamic, "living" financial models that adapt as your business evolves, combining spreadsheet familiarity with Python's power.
- Visualize your revenue logic, expense ledger, and cash flow statement side-by-side on an infinite canvas for clear data auditing.
- Implement driver-based planning with Python variables to instantly update multi-year projections by changing a single assumption.
- Calculate critical metrics like burn rate and runway with clear, auditable Python formulas, making your logic transparent.
- Conduct instant scenario analysis for fundraising rounds by adjusting inputs and seeing real-time recalculations and visualizations.
- Visualize key trends like cash balance and burn rate directly on the canvas, showing investors the impact of changes in real-time.
Ready to build a startup financial model that gives you clarity and investor confidence? Try Quadratic.