This template functions as a comprehensive workforce planning and analysis tool that bridges the gap between static HR data and dynamic financial modeling, enabling strategic labor cost planning for financial sustainability. By integrating standard employee records with Python-based logic, it allows teams to move away from fragile spreadsheet formulas and into automated, code-driven forecasting.
The template is designed to achieve four specific objectives:
- Consolidation: It merges current employee rosters with future hiring plans into a single, cohesive view.
- Automation: It utilizes Python to automatically calculate headcount discrepancies and cost variances between planned and actual figures.
- Visualization: It renders workforce trends and budget impacts through dynamic, code-generated charts.
- Intelligence: It leverages built-in AI to provide qualitative analysis on team structure, identifying risks such as tenure gaps or departmental imbalances.
Managing employee records in the data sheet
The foundation of this template lies in the Data sheet, which acts as the primary storage layer for organizational information. This sheet is designed to handle raw data ingestion without cluttering the visual dashboard.
Structured data input
The employees.csv table contains the core dataset. In the default state, this includes 20 sample records representing a cross-functional team. Users should populate this table with their own data, ensuring the following essential fields are present:
- Identifiers: Employee ID and Employee Name.
- Organizational context: Department (e.g., Engineering, Sales, Marketing, Product) and Role.
- Financials: Current Annual Salary and Start Date.
Automated variance calculation
Adjacent to the raw data, the template utilizes a Python cell named Variance_Analysis. Unlike standard spreadsheet formulas that can break when rows are added, this Python script aggregates the data by department programmatically. It compares actuals from the CSV against planned figures to output a summary table.
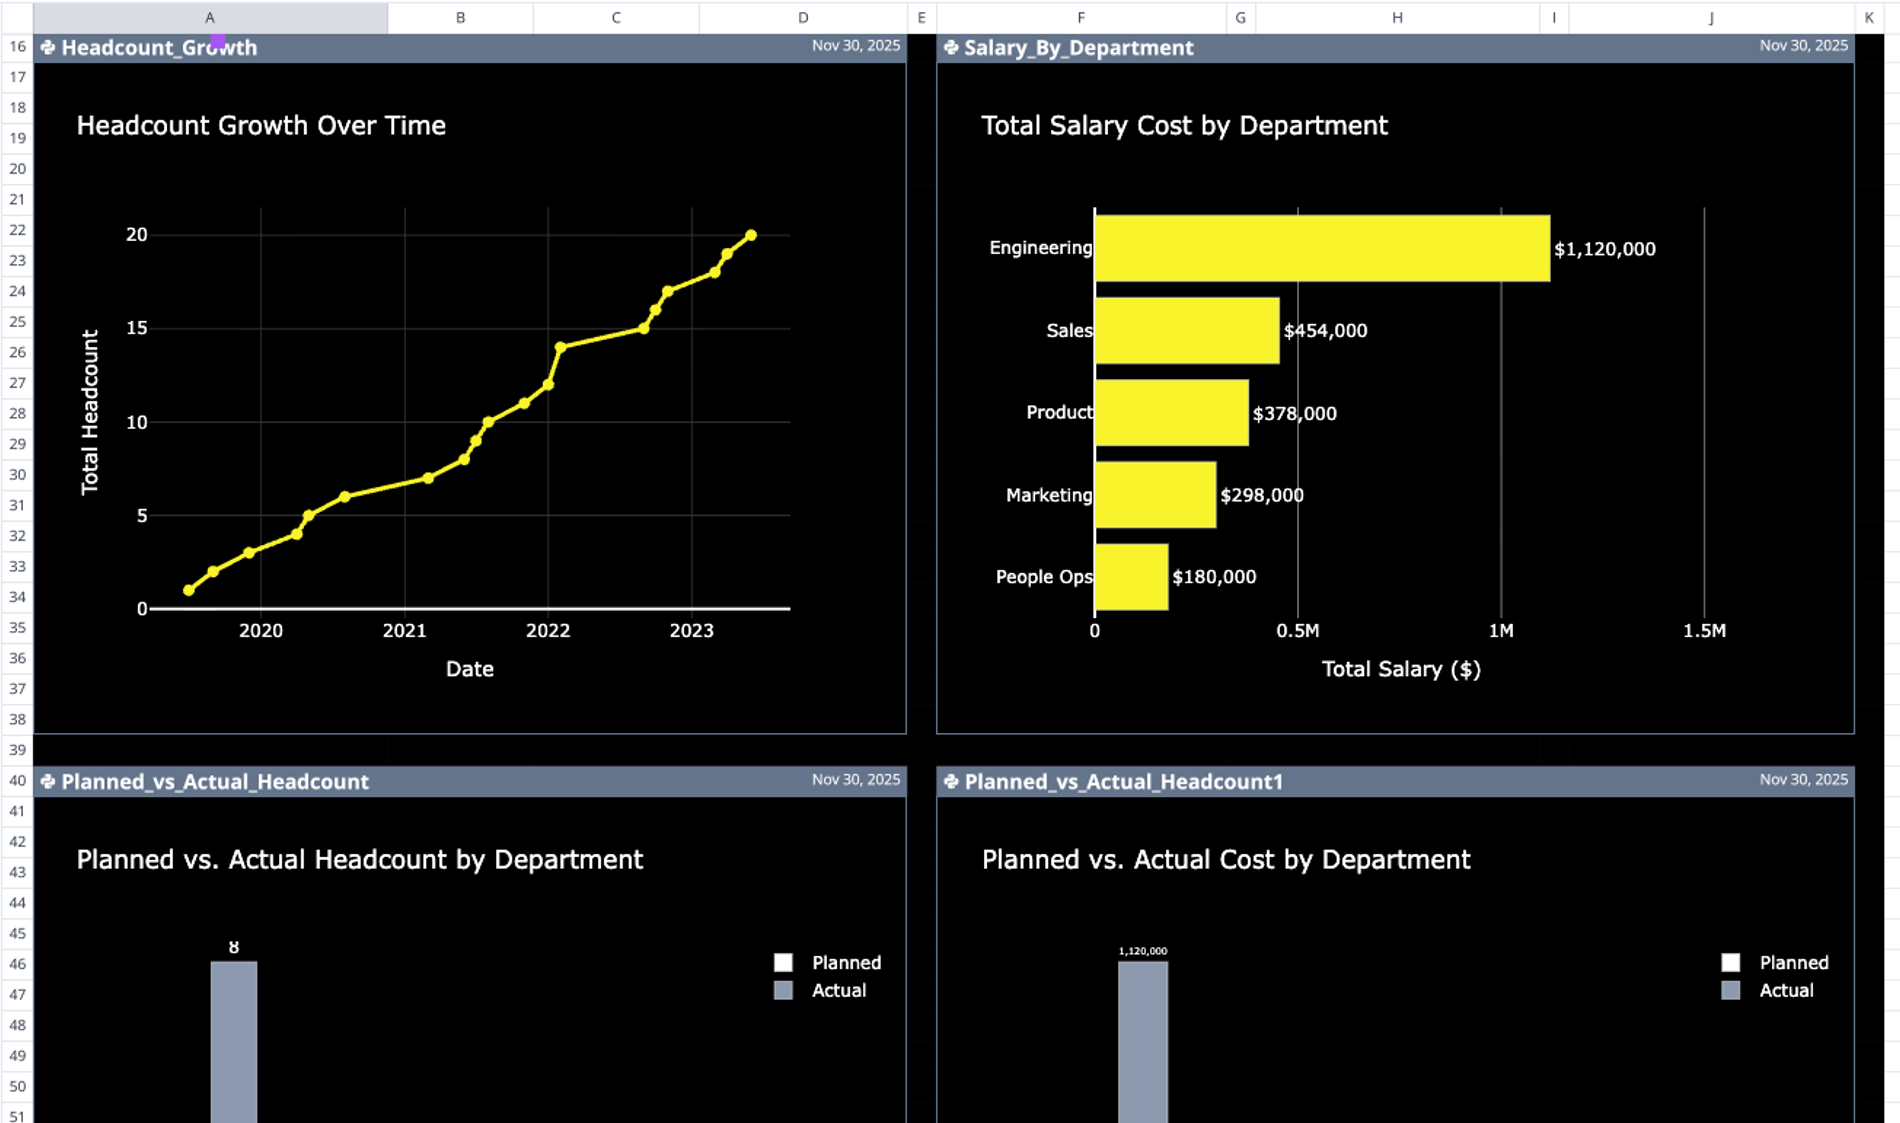
This seven-row summary table highlights critical metrics, such as headcount variance and cost variances. For example, the sample data reveals that the Engineering department has a headcount variance of +6 employees and a cost overrun of $830,000 against the plan, allowing finance teams to instantly pinpoint budget outliers.
Configuring the planning dashboard
The Dashboard sheet serves as the interactive layer where users define the parameters for future modeling. This section allows for scenario planning without altering the underlying historical data.
Defining planning assumptions
At the top of the dashboard, users configure global variables that drive the forecast logic. These inputs are referenced by the Python scripts throughout the workbook:
- Global Annual Attrition Rate: Set to 12% by default, this factors in expected turnover.
- Planned Salary Increase: A 3.5% default assumption for annual merit increases.
- Benefits & Overhead Multiplier: Set at 16%, this ensures total cost of employment (TCOE) is calculated rather than just gross salary.
- Global Start Date: Anchors the forecast timeline to a specific fiscal period.
Building the hiring plan
Below the assumptions, the Hiring Plan table allows users to input open or approved requisitions. This table includes fields for Role, Department, Planned Salary, and Target Start Month. As users add rows to this table—such as the four planned positions in the sample—the forward-looking projections and variance logic automatically update to reflect the new total headcount and associated costs.
Visualizing workforce metrics and AI insights
This template replaces standard charts with Python-based visualizations and AI-driven narrative analysis to provide a clearer picture of workforce health.
Python-based visualizations
The dashboard generates several dynamic charts using Python libraries, ensuring that visualizations scale cleanly as data volume grows:
- Headcount_Growth: Tracks temporal changes in workforce size over the defined period.
- Planned_vs_Actual_Headcount: Performs a visual gap analysis between the current roster and the hiring plan.
- Salary_By_Department: Breaks down financial allocation across different teams to highlight spend concentration.
- KPI Scorecards: Three summary metrics displayed near the hiring plan provide immediate context on total headcount and budget utilization.
Strategic AI recommendations
At the bottom of the dashboard, a prompt-driven AI section analyzes the entire dataset to offer qualitative strategic advice. Instead of just displaying numbers, the AI generates text-based insights regarding:
- Departmental balance: Identifying if specific teams, such as Engineering, are overweight relative to the organization.
- Tenure risks: Flagging potential flight risks among senior staff based on start dates.
- Investment patterns: Highlighting areas of underinvestment, such as Marketing, relative to industry benchmarks.
Who this headcount planning template is for
This template is built for professionals who need to merge HR data with financial planning workflows:
- HR Managers can use this to track attrition rates, manage hiring pipelines, and visualize organizational growth over time.
- Finance Teams (FP&A) can utilize the Python-based variance analysis to automate monthly budget-vs-actual checks without manual reconciliation.
- Operations Leaders can leverage the payroll integration workflow to ensure accurate budgeting for benefits and overhead costs.
Use Quadratic to do headcount planning
- Consolidate current employee rosters with future hiring plans into a single view.
- Automate headcount and cost variance calculations using Python logic.
- Visualize workforce trends and budget impacts with dynamic, code-generated charts.
- Leverage AI to analyze team structure and identify risks like tenure gaps or departmental imbalances.
- Define planning assumptions and build hiring plans without modifying underlying historical data.
- Instantly pinpoint budget outliers by comparing actuals against planned figures.