For a small business owner in the hospitality sector, utilizing a small business bookkeeping template can be crucial, as profit is rarely determined solely by how many coffees or meals are sold. It is determined by the precision with which the business predicts the cost of serving those customers. In an industry with famously thin margins, the difference between a profitable month and a loss often hides in the details of the payroll. Utilizing a professional payroll template can help bring these details to light.
Many owners and operations managers fall into the trap of treating labor as a static lump sum in their financial projections. They might estimate labor as a flat 30% of revenue based on hospitality industry averages or back-of-napkin math. While this simplifies the spreadsheet, it lacks the nuance required for survival in a volatile market. When labor is treated as a single line item, you cannot see which specific roles are driving costs up or where efficiency is leaking out.
True strategic labor cost planning for financial sustainability requires moving beyond aggregated estimations to granular, role-based modeling. This level of detail allows a business to adapt to wage changes, scheduling shifts, and hiring needs without breaking the financial model. To achieve this, forward-thinking analysts and owners are using Quadratic to turn static forecasts into dynamic, flexible models that reflect the reality of their operations.
The "Granularity Gap" in financial projections
The primary obstacle to accurate strategic labor cost planning for financial sustainability is what financial analysts often call the "Granularity Gap." This is the discrepancy between high-level financial summaries and the operational reality on the ground.
In many standard templates, expenses are grouped into broad categories like "Total FOH" (Front of House) or "Total BOH" (Back of House). A business expense tracking template can help break these down for better insight. While this looks clean on a Profit and Loss statement, it creates a blind spot for decision-making. If a projection only shows a total labor cost of $15,000 per month, the owner cannot accurately predict the financial impact of a $2 hourly wage increase for senior staff versus junior staff. They cannot model the specific cost of adding a swing shift on Fridays without manually recalculating the entire lump sum.
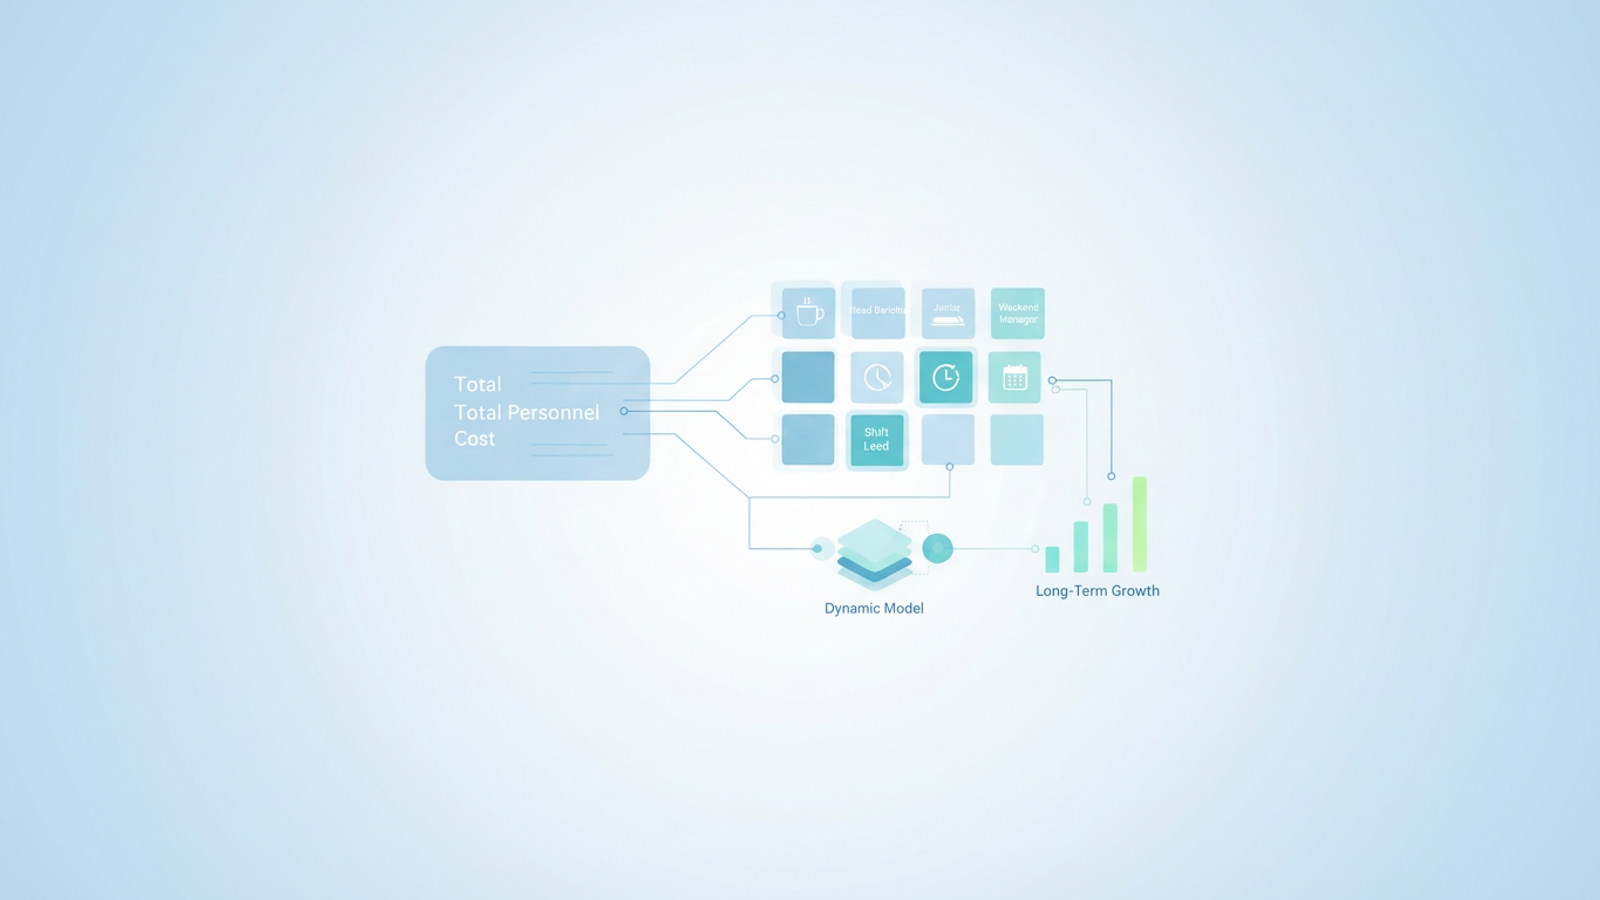
This was the exact challenge facing a cafe owner who recently transitioned their financial modeling to Quadratic. Their existing spreadsheet listed personnel costs as a single, hard-coded number. To ensure the long-term viability of the cafe, they needed to decompose that $15,000 line item into specific roles—Head Barista, Junior Server, Shift Lead—to understand exactly where the money was going and how future staffing decisions would impact the bottom line.
Step 1: Breaking down aggregated expenses by role
The first step in closing the granularity gap is expanding the data structure. In a traditional spreadsheet, expanding a single row into multiple detailed rows can often clutter the main view or make the document difficult to read. The cafe owner utilized Quadratic’s infinite canvas to build a dedicated workspace for labor modeling that fed directly into the main financial projection.
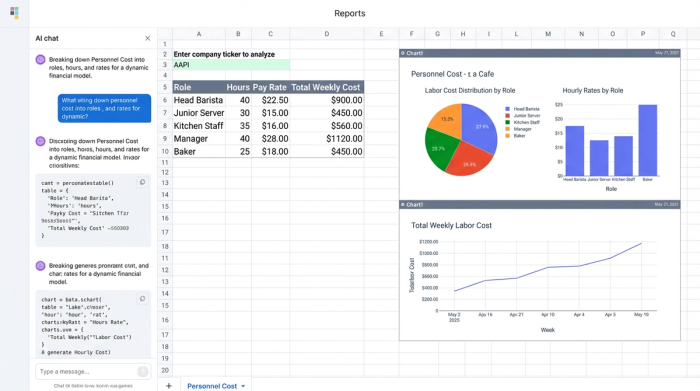
The workflow involved taking the "Personnel Cost" section of the projection and expanding it significantly. Instead of a single cell labeled "Staff Wages," the user created a detailed table that categorized costs by role. This table included distinct columns for the role type, the number of hours worked per week, the hourly pay rate, and the associated payroll taxes.
By structuring the data this way, the model shifted from a static record of payment to a logic-based calculation. The cost for a "Head Barista" was no longer a guess but a product of their specific hours and rate. Quadratic handled this structured data entry easily, allowing the user to keep the detailed calculations visible and organized without overwhelming the primary dashboard used for high-level reporting.
Step 2: Ensuring data integrity during the transition
A common pain point when refining financial models in traditional spreadsheets is the risk of breaking formulas. When a user inserts rows to break down a category, linked formulas in the main Profit and Loss view often fail or return reference errors. This fragility discourages owners from making their models more detailed.
The cafe owner used Quadratic to integrate these new, granular categories back into the main financial model without disrupting the existing logic. Because Quadratic allows for robust data referencing and an infinite grid, the user could build the detailed labor table in a separate area and sum the totals dynamically.
This approach ensured that the "Total Labor Cost" line on the main dashboard became a live figure derived from the granular table. If the owner decided to add a "Weekend Manager" role to the detailed table, the main financial projection updated instantly. There was no need to manually drag formulas or worry about hidden cells being excluded from the sum. The integrity of the data remained intact, providing confidence that the top-level numbers always matched the detailed operational reality.
Moving from static forms to dynamic modeling
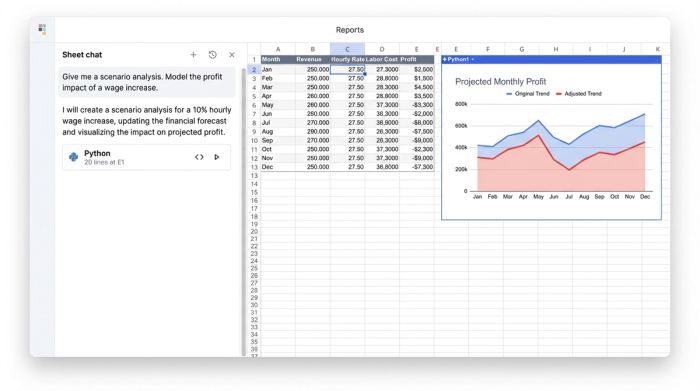
Most articles on financial projections treat them as static forms to be filled out once a year. However, a static model cannot help a business navigate daily or monthly changes. The differentiation in this workflow lies in how the data was formatted to allow for continuous updates, aligning with the principles of dynamic forecasting. The user formatted the labor model in Quadratic to function as a calculator rather than just a ledger. This setup allows for scenario planning. For example, the owner can ask, "What happens to our six-month sustainability outlook if the Head Barista gets a $2 raise?" In a static model, answering this would require manually recalculating the monthly totals and re-entering them. In the Quadratic model, the user simply changes the variable in the "Hourly Rate" column for the Head Barista. The entire projection, from monthly cash flow to year-end profit, recalculates automatically. This turns the spreadsheet into a proactive tool for strategy rather than a reactive report of past expenses.
The result: Accurate forecasting for long-term growth
By transitioning from a lump-sum estimate to a granular, role-based model, the cafe owner achieved a projection that reflects reality rather than just a target percentage. The financial model now serves as a reliable map for the business's future.
This level of accuracy, achieved through robust financial data analytics, provides a significant strategic advantage. Strategic labor cost planning for financial sustainability is not about cutting costs blindly. It is about knowing exactly where to spend resources to generate the best return. The owner now has the clarity to see how staffing changes made today will impact the bank balance six months from now.
Visualizing this data in Quadratic allows the owner to spot trends early. If the model shows that hiring a new server will push labor costs above a sustainable threshold in the slow season, the decision can be deferred. This foresight prevents cash flow crises and ensures that the business grows on a foundation of real data.
Conclusion
Granularity is the key to financial accuracy. You cannot plan for the long-term sustainability of a business if your most significant expense—labor—is lumped together in a single opaque figure. By breaking down costs and utilizing a dynamic tool like Quadratic, business owners can transform their financial projections from static guesses into robust, flexible models that support smart decision-making.
Don't let fragile spreadsheets dictate your business strategy. Start building more robust, granular financial models today with Quadratic.
Use Quadratic to do strategic labor cost planning for financial sustainability
- Break down aggregated labor costs into specific roles, hours, and rates, moving beyond static lump-sum estimates.
- Build dynamic, flexible labor models that update continuously to reflect real-time operational changes.
- Perform instant "what-if" scenario planning, like modeling a wage increase, to see its full financial impact across your projections.
- Maintain data integrity and prevent formula errors when integrating detailed labor data into your main financial models.
- Gain accurate, granular insights into labor cost drivers to make smarter staffing and scheduling decisions for long-term sustainability.
Ready to build more robust financial models and plan for long-term sustainability? Try Quadratic