Table of contents
- Structuring financial models for strategic decision making
- Step 1: Automating assumptions with data pipelines
- Step 2: The core three-statement logic
- Step 3: Valuation metrics (DCF, NPV, and FCF)
- Step 4: Mastering scenario and sensitivity analysis
- Visualizing the output: dashboards & comparative summaries
- Conclusion & template
- Use Quadratic to do FP&A modeling
The late-night panic of a broken reference is a feeling every finance professional knows too well. You are finalizing a complex model for an upcoming board meeting, and suddenly, a change in one assumption breaks a chain of formulas across twelve different tabs. In the high-stakes world of the technology sector, where burn rates and revenue recognition are scrutinized down to the decimal, fragility in your FP&A modeling is a risk you cannot afford.
Financial planning and analysis has historically relied on static spreadsheets that require manual updates and fragile inter-sheet links. However, the industry is shifting. The modern FP&A maturity model is moving away from manual data entry and disconnected spreadsheets toward automated, driver-based forecasting systems. This evolution demands tools that can handle data pipelines, complex logic, and visualization in a single environment for effective financial data analytics.
By utilizing Quadratic, finance teams can modernize their stack. Instead of wrestling with version control and hard-coded numbers, you can build a robust tech-sector model that integrates diverse data—from sales forecasts to tax structures—into a single, infinite workspace. This approach transforms the financial model from a static grid into a dynamic application that updates in real-time.
Structuring financial models for strategic decision making
The architecture of your model determines its usability for strategic decision making in the technology sector. Traditional spreadsheets force you to fragment your logic across linear tabs. You might have assumptions on one sheet, calculations on another, and outputs on a third. This separation makes it difficult to audit the flow of data and increases the likelihood of errors.
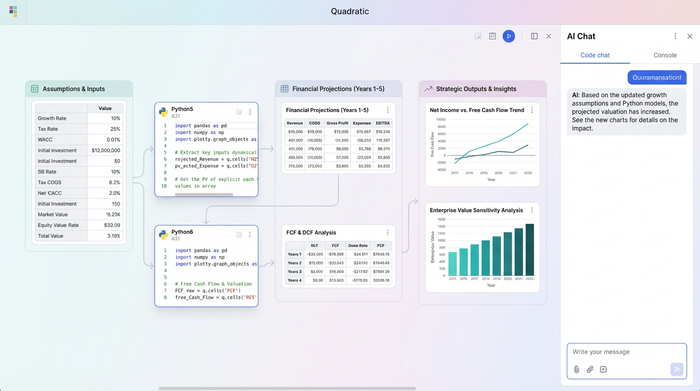
In Quadratic, you work on an infinite canvas. This allows you to lay out your FP&A model visually, creating a logical map of the business. You can place your inputs on the left, flow them into calculations in the center, and display your outputs on the right. For the tech sector, this visibility is critical. When you are modeling high R&D spend, specific revenue recognition schedules, and scalable infrastructure costs, seeing the relationship between these variables prevents logic errors.
A robust model is not just a grid of numbers. It is a transparent representation of the business's operational reality. By visualizing the flow of data, stakeholders can understand the "why" behind the numbers without needing to audit complex cell dependencies hidden in different tabs.
Step 1: Automating assumptions with data pipelines
A significant gap in traditional modeling advice is the focus on manual input. Most tutorials suggest typing assumptions into cells, but in a mature workflow, data should flow automatically. This is where the role of predictive models in FP&A becomes tangible. Rather than manually copying sales data from a CRM export, you can build data pipelines directly into your spreadsheet.
Using SQL or Python within Quadratic, you can ingest diverse financial data sources instantly, including data from OCR financial statements. For a tech company, this might look like pulling live sales forecasts directly from your database or fetching historical cost structures to inform future assumptions. You can also automate the retrieval of external variables, such as current tax rates or inflation indices.
This creates FP&A financial models that are living documents. When the source data updates, your model updates. This eliminates the risk of copy-paste errors and ensures that your strategic decisions are always based on the most current information available.
Step 2: The core three-statement logic
At the heart of any financial model lies the linkage between the Income Statement, Balance Sheet, and Cash Flow Statement, often referred to as a three-statement financial model. While this structure is standard, the execution often suffers from the limitations of a standard FP&A model Excel file. In a traditional environment, balancing the balance sheet often involves circular references and iterative calculation settings that can slow down performance.
You can calculate metrics like Revenue, Gross Profit, EBIT, and Net Income for comprehensive P&L analysis using consistent formatting and editable formulas that are easier to read and debug.
For technology companies, specifically those dealing with hardware or heavy server infrastructure, handling Capital Expenditure (CAPEX) is complex. You can use Python to script the depreciation schedules of various asset classes and flow them precisely into the Balance Sheet and Cash Flow Statement. This ensures that working capital adjustments and CAPEX assumptions are accurate and traceable.
Step 3: Valuation metrics (DCF, NPV, and FCF)
Once the core statements are built, the focus shifts to valuation. Calculating Free Cash Flow (FCF), Net Present Value (NPV), and using the Discounted Cash Flow (DCF) methodology often requires complex formulas that can become unreadable in a standard formula bar.
In this modern workflow, you can use Python to handle the heavy lifting of discounting formulas while keeping the output visible in the spreadsheet grid. You can visualize the logic by mapping the flow of the Discount Rate and Terminal Value directly into the final NPV calculation on the canvas.
This transparency is vital for stakeholder confidence. When executives ask how a change in the discount rate affects the valuation, you can point to the visual flow on the canvas rather than digging through nested parentheses in a cell formula.
Step 4: Mastering scenario and sensitivity analysis
One of the greatest pain points in traditional modeling is "scenario chaos." To create a Best Case, Base Case, and Worst Case, analysts often duplicate tabs. This triples the maintenance work; if you find a logic error in one tab, you have to fix it in three places.
Quadratic resolves this by allowing you to run detailed scenario analyses and sensitivity analysis using variables, and even advanced techniques like Monte Carlo simulation. You can define a variable in Python, such as growth_rate, and reference it throughout your model. To run a scenario, you simply toggle that single variable, and the entire model updates instantly.
This capability is essential for break-even analysis. You can calculate the break-even points for different tech project scenarios—such as varying customer acquisition costs or churn rates—without breaking the model structure, akin to performing dynamic financial stress tests. When looking for the best FP&A tools for fundraising modeling and investor dashboards, the ability to toggle scenarios live during a meeting is a powerful differentiator.
Visualizing the output: dashboards & comparative summaries
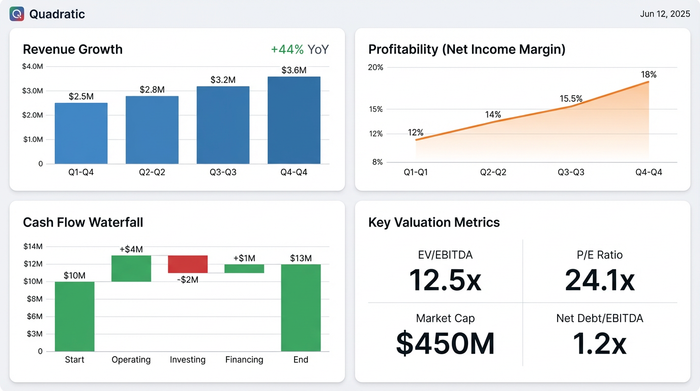
The final step is presenting the data. Investors and board members do not want to navigate a dense grid of raw data. They need clear, comparative summaries that highlight the strategic narrative.
Because Quadratic combines a spreadsheet with an infinite canvas, you can build investor dashboards directly next to your analysis. You can create charts, summary tables, and key metric callouts that maintain consistent formatting. This turns your working model into a presentation-ready artifact.
For fundraising modeling, this allows you to present a clean view of the business's potential while retaining the ability to drill down into the underlying logic if questions arise. You avoid the disconnect between the "presentation deck" and the "financial model" because they exist in the same workspace.
Conclusion & template
Modern FP&A modeling requires tools that blend the flexibility of spreadsheets with the power and structure of code. By moving away from fragile, manual processes and embracing a workflow that utilizes data pipelines and infinite canvases, finance professionals can build models that are resilient, auditable, and strategic.

It is time to stop building models that break under pressure. Start building robust financial applications that drive decision-making.
To help you get started, we have created a resource that mirrors the tech-sector workflow described in this article. You can access the FP&A model template to see how Python, SQL, and the infinite canvas come together to create a superior modeling experience.
Try the FP&A Model Template in Quadratic
Use Quadratic to do FP&A modeling
- Build robust models that don't break by integrating diverse data into a single, infinite workspace, turning your model into a dynamic application that updates in real-time.
- Automate data ingestion using SQL or Python to pull live sales forecasts, historical costs, and external variables directly into your model, eliminating manual copy-paste errors.
- Visualize complex logic on an infinite canvas, mapping inputs to calculations and outputs, making your three-statement model transparent and easy to audit.
- Master scenario and sensitivity analysis by defining variables in Python and instantly toggling them to run best-case, base-case, and worst-case scenarios without duplicating tabs.
- Streamline advanced calculations for valuation metrics like DCF, NPV, and FCF, using Python to handle complex formulas while keeping the output visible in your spreadsheet.
- Create presentation-ready investor dashboards directly alongside your analysis, combining charts, summary tables, and key metrics in one workspace for clear, comparative summaries.
Ready to build more resilient financial models? Try Quadratic.