Table of contents
- Why build your own budgeting system?
- Step 1: Escaping the "tab fatigue" with an infinite canvas
- Step 2: Defining categories and data entry
- Step 3: Automating aggregation (Python over formulas)
- Step 4: Visualizing variance (Planned vs. Actual)
- Step 5: The annual roll-up
- Conclusion: A living financial system
When you search for a family budget app, the results usually point to the same few mobile applications. These tools are often polished and pretty, but they come with significant limitations. They force you into rigid categories, hide your data behind paywalls, or break connections with your bank accounts constantly. Consequently, many heads of households turn to spreadsheets, seeking the freedom to manage finances their way. However, traditional spreadsheets like Excel or Google Sheets introduce their own problems: "tab fatigue" from clicking through twelve separate monthly tabs and fragile formulas that break the moment you insert a new row.
The best family budget app is often the one you build yourself, tailored specifically to your household’s unique financial DNA. By using Quadratic, you can create a robust, custom budgeting system that combines the flexibility of a Python spreadsheet with the power of a database. This guide explores how a real user utilized Quadratic’s infinite canvas and Python integration to build a system that tracks detailed monthly expenses and annual summaries side-by-side, solving the fragility and visibility issues inherent in standard tools.
Why build your own budgeting system?
Most family budgeting apps operate on a "one size fits all" philosophy. They might group "Dining Out" and "Groceries" into a single "Food" bucket, or they may not support the granular tracking required for specific needs like tuition payments, complex hobby expenses, or irregular income streams. Building your own system allows for infinite granularity. You can define subcategories that reflect your actual life, not a developer’s assumption of it.
Furthermore, the most effective way to manage household wealth is through a "Planned vs. Actual" methodology. This involves setting a target for every dollar at the start of the month and comparing it against reality as spending occurs. While some apps attempt this, they often lack the flexibility to handle mid-month adjustments without throwing off historical data. When you own the system, you own the logic. You eliminate sync errors and privacy concerns, ensuring your financial data remains yours alone.
Step 1: Escaping the "tab fatigue" with an infinite canvas
The structural flaw of traditional spreadsheets is that they rely on tabs to organize time. In a standard setup, you might have one tab for January, another for February, and so on. To compare March’s spending against January’s, you have to click back and forth, losing context with every switch. This lack of visibility makes it difficult to spot trends.
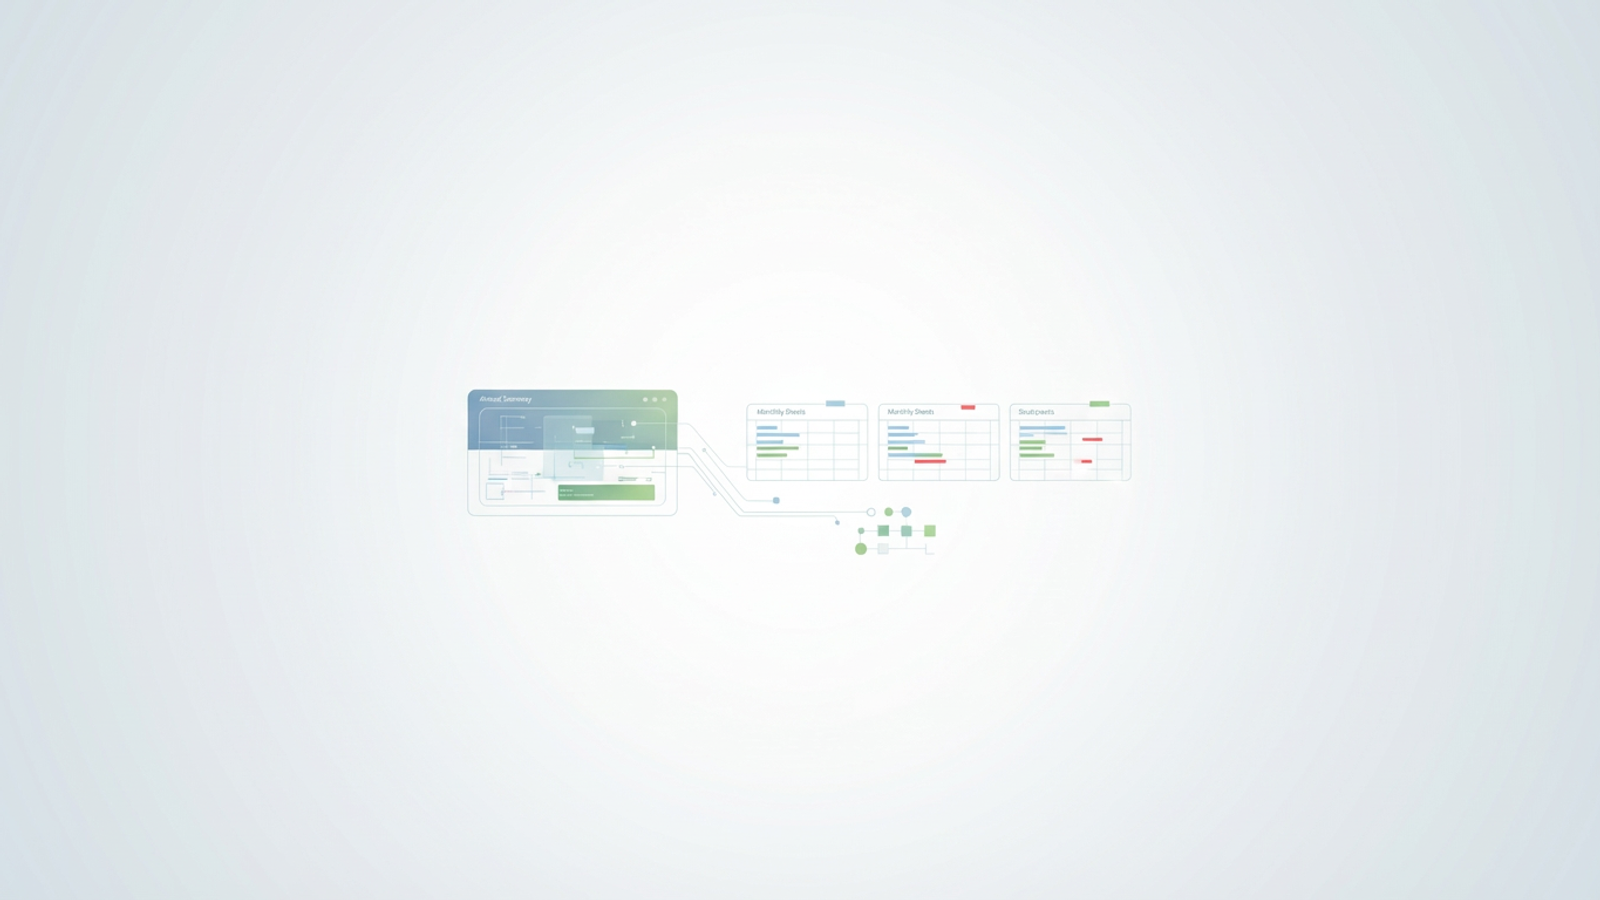
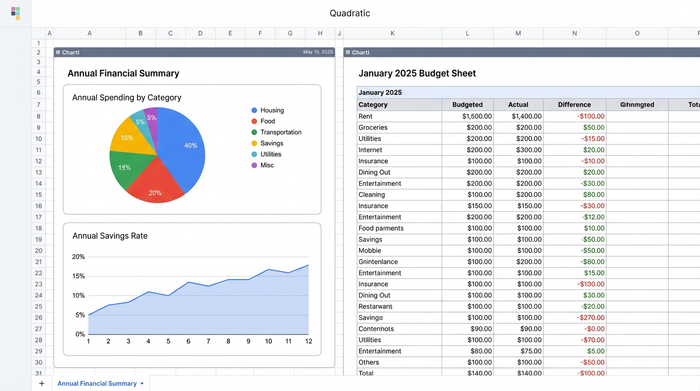
In Quadratic, the infinite canvas changes the paradigm. Instead of hiding months in separate tabs, you can lay out your entire financial year on a single, expansive 2D plane. A typical layout involves placing the Annual Summary—your high-level dashboard—on the left side of the canvas. Extending to the right, you place your monthly sheets (January, February, March) horizontally or in a grid.
This spatial organization allows for side-by-side comparison. You can scroll from your January details directly to your Annual Summary without losing your place. This visibility is a feature rarely found even in the best budget apps for families, giving you an immediate, holistic view of your financial health without the friction of navigation.
Step 2: Defining categories and data entry
Effective budgeting requires a clear hierarchy. Generic apps for family budget management often struggle with complex custom categories, but a custom system thrives on them. In this workflow, you define a structure that moves from specific Subcategories (e.g., "Piano Lessons") to Main Categories (e.g., "Education") to a Monthly Total.
The workflow for the user is simple. You set up a data entry section for each month where you log expenses and gain insights as they happen. Each row consists of the Date, Description, Amount, and Category. To keep this data clean, you can use Quadratic’s data validation features. By creating dropdown menus for your categories, you ensure that "Groceries" is always spelled the same way. This consistency is crucial because it ensures that when the system aggregates your spending later, nothing gets missed due to a typo.
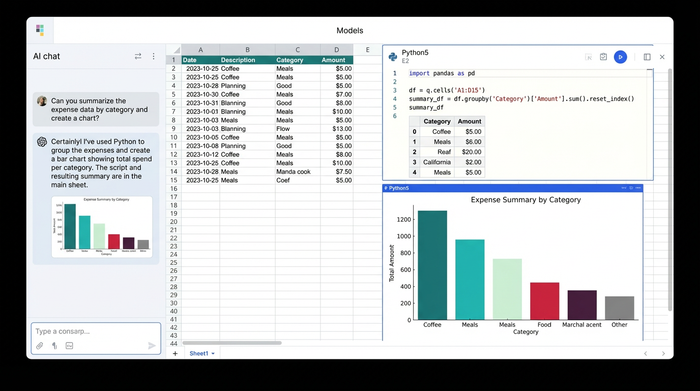
Step 3: Automating aggregation (Python over formulas)
This is where the "Formula Fragility" gap usually destroys a standard spreadsheet budget. In Excel, if you have a summary cell calculating =SUM(C2:C50) and you add a 51st expense row, that new expense might be excluded from the total unless you manually update the range. If you delete a row, you might see a #REF! error ripple through your entire workbook.
Quadratic solves this by allowing you to use Python or SQL directly within the sheet. Instead of fragile cell references, you can write a simple script that acts like a database query. For example, you can tell the system to "Select all expenses where Category equals 'Groceries' and Month equals 'January'."
Because this is code-based, it is dynamic. You can add three rows of expenses or three hundred; the Python script automatically captures every single entry and updates the Annual Summary instantly. This transforms your sheet from a fragile calculator into a resilient application. For users looking for the best budget app for family use, this reliability is the difference between a tool you trust and one you constantly have to fix.
Step 4: Visualizing variance (Planned vs. Actual)
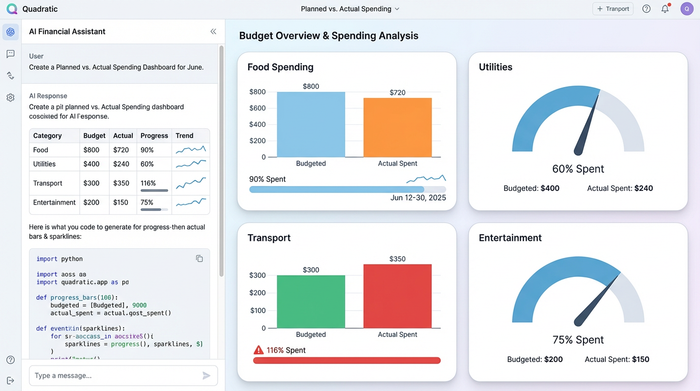
Data is only useful if it changes behavior. To prevent overspending, you need immediate visual feedback. In this system, every category has two dedicated columns: "Budgeted" (what you planned to spend) and "Spent" (what you actually spent).
You can implement visual indicators to highlight variance immediately. At a basic level, conditional formatting can turn a cell red if the "Spent" column exceeds the "Budgeted" column. However, because Quadratic supports Python, you can go further than standard budgeting apps for families. You can use a Python library like Matplotlib or Altair to generate small sparklines or progress bars directly inside the cell next to the category. This allows you to see the velocity of your spending—knowing not just that you have spent $500, but that you spent it all in the first week of the month.
Step 5: The annual roll-up
The final piece of the puzzle is the Annual Summary. Because you set up the spatial layout in Step 1 and the robust aggregation in Step 3, this step is largely automated. The individual monthly data feeds into the dashboard on the left side of your canvas.
This summary view aggregates all monthly totals into a year-to-date view. You can see exactly how much you have spent on "Home Maintenance" across the entire year, compared to your annual allowance. This "Big Picture" view is essential for forecasting. If you see that you are under budget in one category halfway through the year, you can confidently reallocate those funds to savings or another need. This high-level control is often missing in standard mobile tools, which tend to focus strictly on the current month.
Conclusion: A living financial system
While there are many family budget apps on the market, they often force you to compromise between ease of use and depth of data. By building a custom system in Quadratic, you get the best of both worlds: the easy data entry of a spreadsheet and the robust, unbreakable logic of a database.
You have built a tool that grows with your family, eliminates the frustration of broken formulas, and keeps your entire financial life visible on one surface. If you are ready to take control of your household finances without the limitations of rigid software, start with a blank Quadratic canvas and build the last budget system you will ever need.
Use Quadratic to track your family budget
- Build a custom budget tailored to your family: Define unlimited granular categories and tracking rules that fit your unique financial situation, unlike rigid off-the-shelf apps.
- Eliminate "tab fatigue" with an infinite canvas: Lay out your annual summary and all monthly details side-by-side on a single, expansive workspace for immediate, holistic financial visibility.
- Automate aggregation with unbreakable Python logic: Dynamically sum expenses and update totals without fragile formulas, ensuring your budget remains accurate even as you add or remove rows.
- Visualize "planned vs. actual" spending instantly: Create custom visual indicators to highlight budget variances and spending velocity, making it easy to prevent overspending.
- Get a comprehensive annual roll-up: Automatically aggregate all monthly data into a year-to-date summary for powerful forecasting and strategic financial reallocation.
- Maintain complete ownership and privacy of your data: Control your financial information in a secure system you build, free from third-party sync errors or privacy concerns.
Ready to build the last budget system your family will ever need? Try Quadratic.