
Table of contents
- Introduction: the challenge of modern portfolio analysis
- Why "build your own" beats rigid software
- Step 1: ingesting and organizing deal data
- Step 2: advanced filtering with SQL (beyond Excel filters)
- Step 3: visualizing deal distributions and trends
- Step 4: multi-currency and global reporting (optional complexity)
- Conclusion: a dashboard that grows with your portfolio
- Use Quadratic to do portfolio analysis for investment deals
Introduction: the challenge of modern portfolio analysis
For investment analysts and portfolio managers, the deal log is the heartbeat of the business. You are constantly tracking attributes like geographic location, investment dates, specific strategies, industry sectors, and deal status. The challenge isn't usually getting the data; it is performing financial data analytics to answer specific questions about that data quickly and presenting it in a way that stakeholders can understand.
Most professionals hit a wall when looking for a portfolio analysis tool. Traditional platforms force you into rigid templates that don't quite fit your specific thesis or deal structure. On the other hand, relying solely on an investment tracking spreadsheet leads to "dashboard fatigue." You end up with a workbook full of overlapping charts, hidden filters that ruin data integrity, and version control nightmares.
Quadratic offers a modern alternative. It is a flexible, infinite workspace that combines the familiarity of a spreadsheet with the power of Python and SQL. Instead of fighting against the grid, you can build a custom reporting environment that adapts to your workflow, not the other way around.
Why "build your own" beats rigid software
When teams start looking for software, they often search for lists of the best portfolio analysis tools or gravitate toward enterprise standards like the FactSet portfolio analysis tool or the Fidelity portfolio analysis tool. These platforms are powerful for public market data and standard reporting, but they often struggle with the ad hoc nature of private deal analysis where parameters change daily.
If you need to slice deal data by a custom "niche strategy" or a specific geographic sub-region, rigid software often requires a workaround or a request to IT. This leaves a gap where analysts need flexibility but also need more power than a standard spreadsheet provides.
Quadratic fills this gap with three distinct advantages. First, the infinite canvas means you never run out of space or have to layer charts over your data cells. Second, the transparency of using code means you see the logic behind every number, not just the result. Finally, for individual analysts or smaller firms, finding a free portfolio analysis tool that handles complex logic without expensive licensing fees is rare. Quadratic allows you to build sophisticated, auditable models without the enterprise overhead.
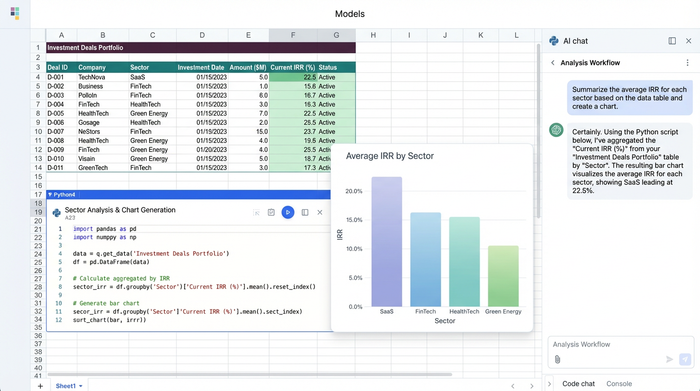
Step 1: ingesting and organizing deal data
In this workflow, we start with a standard dataset: a list of investment deals. This data includes the geographic location of the asset, the date of investment, the strategy (e.g., Value-Add, Core, Opportunistic), the industry sector, and the current deal status.
In a traditional spreadsheet, you are immediately constrained by the layout. If you put your raw data in columns A through F, you have to put your analysis in column H, and your charts somewhere off to the right. If the data grows, it pushes everything else out of alignment.
With Quadratic, you can place your raw deal data on the left side of the canvas. Because the canvas is infinite, you can pan over to a completely clear area to begin your analysis. This solves the "layout constraint" problem instantly. You can keep your ingestion area separate from your reporting area, ensuring that organized presentation is never compromised by the size of your dataset.
Step 2: advanced filtering with SQL (beyond Excel filters)
One of the biggest risks in portfolio reporting is the "hidden filter." In Excel, if you want to exclude a specific investment strategy—say, "High Risk" deals—you usually click a dropdown menu and uncheck a box. Two weeks later, when someone else opens the file, there is no visual indication that data is being hidden. This is a compliance risk and a headache for auditing.
Quadratic allows you to use SQL directly within the spreadsheet to create clean, auditable views of your data. Instead of clicking a hidden checkbox, you write a simple query in a cell:
SELECT * FROM deals WHERE strategy != 'High Risk'
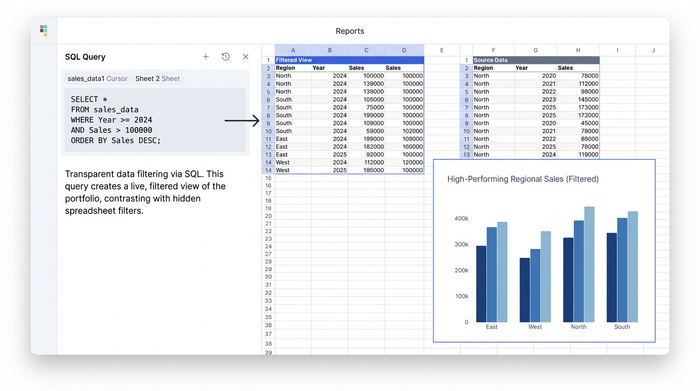
This query automatically pulls a live, filtered copy of your data into a new location on the canvas. This approach rivals specialized financial modeling tools with portfolio analysis features because it is entirely transparent. Anyone reading the report can look at the code cell and see exactly what logic was applied to the data. You aren't just presenting numbers; you are presenting the logic that derived them.
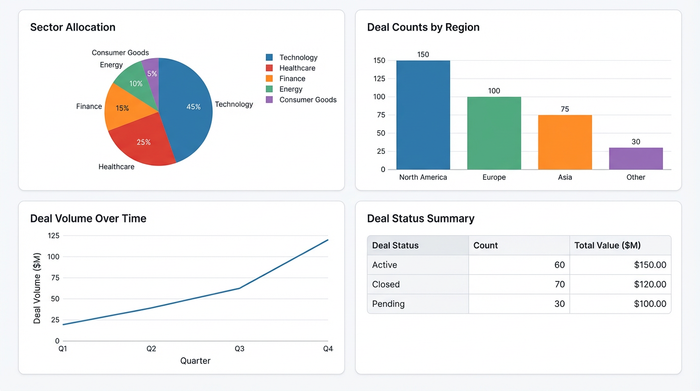
Step 3: visualizing deal distributions and trends
Once your data is cleaned and filtered using SQL, the next step is visualization. The goal is to generate comprehensive reports that compare deal counts by category and track trends over time.
Because you are working on an infinite canvas, you can arrange these visuals side-by-side with your data, creating a dashboard view that tells a complete story.
- Pivot Tables: Use these to summarize deal counts by category, such as how many deals are in "Due Diligence" versus "Closed."
- Pie Charts: These are effective for visualizing sector allocation, giving you a quick view of your exposure to Tech versus Real Estate.
- Bar Charts: Use these to compare deal counts by geographic region, helping you identify if your portfolio is overweight in a specific territory.
- Line Charts: These track deal volume over time, allowing you to perform time series analysis and see if your deal flow is accelerating or slowing down.
This setup transforms your sheet into a portfolio monitoring tool customizable dashboards bi analysis capabilities are built right into the grid. You don't need to export data to a separate BI tool to get professional-grade visuals; you can create a dashboard in Python right where your data lives.
Step 4: multi-currency and global reporting (optional complexity)
For portfolios that span multiple regions, currency conversion is often a stumbling block. Standard spreadsheets usually require manual entry of exchange rates or clunky external plugins.
In Quadratic, you can leverage Python integration to handle this effortlessly. Using libraries like forex-python, you can script automatic currency conversion based on the "Geographic location" attribute of your deal data. This allows you to normalize all deal values into USD (or your base currency) instantly.
While many portfolio analysis tools multi-currency reporting features are paid add-ons or enterprise-only tiers, Quadratic allows you to script this logic yourself. This gives you global reporting capabilities without the rigidity of a pre-built system.
Conclusion: a dashboard that grows with your portfolio
By moving your deal log into Quadratic, you transition from a static spreadsheet to a dynamic data application. You started with raw deal data, used SQL to filter out specific strategies transparently, and visualized the results on an infinite canvas that never feels cluttered.
This workflow demonstrates why Quadratic is becoming one of the top portfolio analysis tools used by hedge funds and analysts who demand flexibility. You get the power of code, the ease of a spreadsheet, and the visual freedom to report exactly what you need.
If you are ready to stop fighting with layout constraints and hidden filters, load your deal data into Quadratic today and experience a better way to build your analysis.
Use Quadratic to do portfolio analysis for investment deals
- Build flexible, custom reports for your unique deal structures and investment strategies, moving beyond rigid software templates.
- Organize deal data and analysis on an infinite canvas, ensuring your raw data never clashes with your evolving reports and visualizations.
- Apply transparent, auditable filters with SQL, eliminating hidden data views and ensuring stakeholders see the exact logic behind every number.
- Create dynamic dashboards with charts and pivot tables directly in your sheet, visualizing deal distributions, trends, and sector allocations without exporting to separate tools.
- Automate multi-currency conversions using Python, effortlessly normalizing global deal values for comprehensive, accurate reporting.
- Develop sophisticated, auditable models for private deal analysis, leveraging code power without the typical enterprise software overhead.
Ready to build dynamic, transparent portfolio analysis? Try Quadratic.