
Managing finances across multiple institutions often leads to "tab fatigue"—the exhausting ritual of logging into checking, savings, brokerage, and credit card portals just to answer a simple question: "How much liquid cash do I actually have?" For financial analysts, business owners, and technical prosumers, the standard solutions rarely fit. Consumer apps are often too rigid, forcing your data into pre-set categories, while a traditional bank account spreadsheet in Excel or Google Sheets requires brittle formulas and constant manual maintenance to stay relevant.
Quadratic offers a third way. By combining the familiarity of a spreadsheet with the power of an infinite canvas and native Python integration, you can build a flexible, automated bank account tracker that fits your specific needs. This isn't just about listing transactions; it is about building a "single pane of glass" that unifies your balances, actively monitors for anomalies, and visualizes your financial health in real-time. In this guide, we will walk through how to build a tracker that consolidates your data and uses Python to automate financial data analytics of your cash flow.
Why you need a "single pane of glass" for cash management
For the "Manager" or "Strategist" persona—whether you are running a small business or managing a complex personal portfolio with a portfolio analysis tool—knowing your current balance is not enough. You need to understand "Cash Positioning." Cash positioning goes beyond a simple snapshot; it is the strategic understanding of where your capital sits, which accounts are funding which expenses, and when transfers need to happen to maintain liquidity.
Most standard bank tracking tools fail here because they are designed for retrospective observation. They tell you what you spent last month, but they rarely help you model what needs to move today using advanced techniques like Monte Carlo simulation. By building a custom bank account balance tracker in Quadratic, you bridge the gap between raw data and decision-making. You can centralize data from high-yield savings accounts, operating checking accounts, and credit lines into one view. This centralization allows for faster decisions, such as identifying when to transfer funds to cover payroll or when to move excess cash into investments, ensuring your money is always working efficiently.
Step 1: Centralizing your data (ingestion)
The first step in building your tracker is ingestion. You need a reliable way to get transaction and balance data onto the canvas. In Quadratic, you have the flexibility to choose between automation and strict privacy control.
For users who prefer automation, you can use Python to connect to bank account syncing tools for expense tracking. If you have API access (via services like Plaid or custom banking APIs), you can write a Python script directly in a cell to fetch your latest transactions and balances. This creates a live feed that updates whenever you run the script, eliminating manual entry.
However, many users are wary of sharing credentials with third-party aggregators and search for an app to track spending without linking bank account credentials directly. Quadratic is ideal for this privacy-focused workflow. You can simply export CSV files from your various banking portals and drag-and-drop them directly onto the Quadratic canvas. Because Quadratic allows you to query these CSVs using SQL or Python, you don't need to copy-paste data into a master sheet manually. The uploaded files act as your raw database, and your tracker reads from them automatically. This gives you the power of a database with the privacy of a local file.
Step 2: Automating analysis with Python (the differentiator)
Once your data is on the canvas, the real work begins. In a traditional spreadsheet, analyzing this data would require complex IFS statements or conditional formatting rules that break easily. In Quadratic, we use Python to add logic and intelligence to your bank account expense tracker.
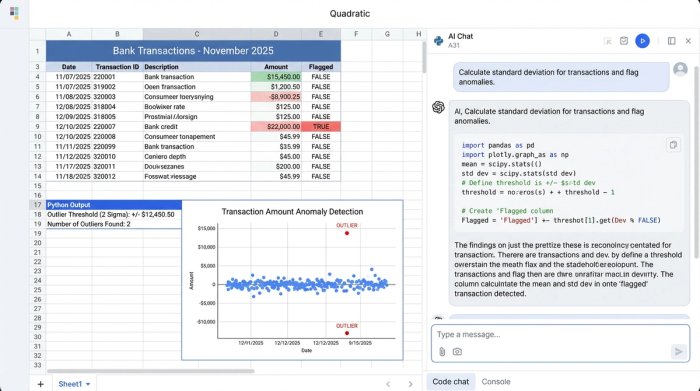
The goal here is to move beyond basic sums and implement "management by exception." You don't need to review every $5 coffee purchase; you need to know about the outliers. Using a Python cell, you can write a script that analyzes your transaction history to flag anomalies.
For example, you can write a script that calculates the average withdrawal amount and standard deviation for your operating account. You can then program the tracker to automatically flag any transaction that exceeds two standard deviations from the mean. This effectively creates an automated detection system for unusual withdrawals or "Red Flags." Instead of manually scanning rows of data, the spreadsheet tells you exactly which transactions require your attention. You don't need a degree in machine learning to do this; you just need a few lines of Python to turn a static list into an active monitoring tool.
Step 3: Visualizing cash positioning & trends
With your data centralized and your logic established, the final step is financial data visualization. Because Quadratic operates on an infinite canvas, you can build a dashboard that sits right next to your data and code, rather than on a separate tab.
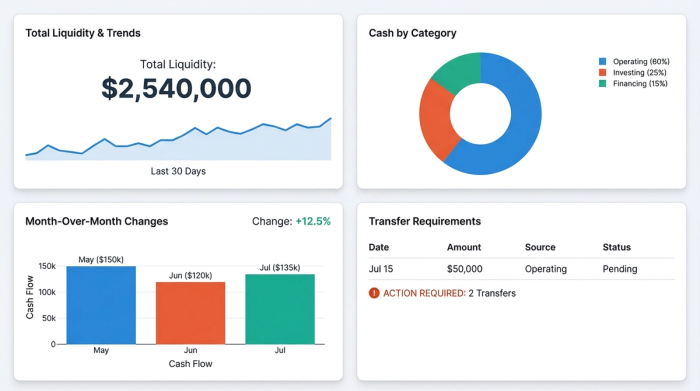
You can set up a summary table or graph that visualizes your cash positioning. Key metrics to track include:
- Total Liquidity: A sum of all liquid assets across checking and savings.
- Month-Over-Month (MoM) Changes: A Python-generated comparison of your burn rate or savings rate compared to the previous period.
- Transfer Requirements: Logic that highlights if a specific checking account is dipping below a safety threshold (e.g., $5,000), prompting a transfer from savings.
This visual layer transforms your bank account tracker from a data repository into a decision engine. You can see at a glance if your cash flow is healthy or if liquidity is tightening, allowing you to react before an account is overdrawn.
Adapting the tracker for specialized use cases
The flexibility of Quadratic allows this system to be adapted for highly specific, complex financial scenarios that off-the-shelf apps simply cannot handle.
One such scenario is estate management. Executors often struggle to find a software tool to track executor transactions for a deceased bank account that offers the necessary audit trails and immutability. By using Quadratic, an executor can upload bank statements, write Python scripts to categorize expenses (e.g., "Funeral Costs," "Debts," "Distribution"), and maintain a clear, code-backed record of how every cent was handled. The code provides a transparent logic trail that is easier to audit than opaque spreadsheet formulas.
Similarly, for high-net-worth individuals or power users looking for an app to track all bank accounts—including international accounts, crypto wallets, or private equity capital calls—Quadratic provides the necessary freedom for clear crypto visualization. You aren't forced into a "budgeting" box designed for the average consumer. You can build a custom schema that reflects your actual financial reality, no matter how complex the asset mix.
Conclusion
A bank account tracker should be more than just a digital receipt box; it should be a tool that works for you, offering insights that drive better financial decisions. By building your tracker in Quadratic, you gain the data power of a custom application with the intuitive interface of a spreadsheet. You can unify disparate accounts, automate the detection of anomalies, and visualize your true cash position without relying on rigid apps or fragile Excel formulas. Whether you are managing personal wealth, a small business, or an estate, Quadratic gives you the control to build exactly what you need.
Use Quadratic to track bank accounts
- Unify all accounts: Consolidate checking, savings, brokerage, and credit card data into a single, comprehensive view, eliminating "tab fatigue."
- Automate data ingestion: Connect via Python for live API feeds or securely drag-and-drop CSV files that can be queried, giving you control over data privacy.
- Detect anomalies automatically: Implement custom Python scripts to flag unusual transactions or "Red Flags," moving beyond manual scanning.
- Gain real-time cash positioning: Visualize total liquidity, month-over-month changes, and transfer requirements on an infinite canvas to make proactive financial decisions.
- Build custom financial logic: Create advanced analytics and strategic transfer prompts that rigid, off-the-shelf tools cannot offer.
- Manage complex scenarios: Adapt the tracker for specialized needs like estate management or diverse high-net-worth portfolios with transparent, auditable code.
Ready to build a powerful, custom bank account tracker? Try Quadratic.