
Table of contents
- The spectrum of classification standards
- Three common Business Category Classification Methods
- Benchmarking accuracy: the "cage match" experiment
- Measuring performance: precision, recall, and confusion matrices
- The "human-in-the-loop" workflow
- Why this workflow beats standard Excel or pure Python
- Conclusion
- Use Quadratic to benchmark and improve business category classification methods
Every finance analyst knows the sinking feeling of opening a raw transaction export. The data is messy, the merchant names are inconsistent, and the descriptions are cryptic strings like "AMZN MKTP US" or "SQ *Coffee House." Turning this chaos into structured insights by cleaning transaction descriptions in financial data requires mapping thousands of rows to a clean taxonomy, a task that often falls into the manual drudgery of copy-pasting or maintaining fragile spreadsheet formulas without strong QuickBooks analytics workflows in place.
While standardized codes like NAICS or GICS provide the destination, the journey—getting raw bank data mapped to those codes—is the hard part. Many teams struggle because they rely on a single approach that hits a ceiling of accuracy. The reality is that there is no single perfect method for automated data processing. The most effective strategy involves benchmarking different business category classification methods against one another, comparing rigid rules, keyword heuristics, and modern AI to find the right balance of precision and recall.
This is where Quadratic changes the workflow. By acting as an evaluation layer where Python scripts, API calls, and standard spreadsheet data live side-by-side, analysts can test these classification strategies in real-time. Instead of guessing which method works best, you can run a "cage match" between them, measure the results, and build a system that actually works.
The spectrum of classification standards
Before diving into the mechanics of classification, it is important to define the target. Most businesses aim to map transactions to a standard hierarchy. This might be the NAICS code mapping (North American Industry Classification System) used for government reporting and economic analysis, or a custom internal taxonomy designed for specific spend analysis, such as separating "SaaS Tools" from "Travel & Entertainment," or the GICS classification system.
The problem is rarely the taxonomy itself. The challenge lies in the sheer variety of inputs. A single vendor might appear in your bank feed in five different ways depending on the payment processor or location. Having a list of codes doesn't help you map "UBER *TRIP" to "Ground Transportation" without a logic layer in between. The challenge isn't choosing the taxonomy; it's choosing the method to apply that taxonomy to thousands of rows of new data every month.
Three common Business Category Classification Methods
To solve this, analysts typically rely on three core methodologies. Each has distinct strengths and weaknesses, and understanding them is the first step toward building a robust automated transaction categorization pipeline.
Method 1: Deterministic (rules-based)
This is the traditional approach, often implemented via VLOOKUP or Index-Match in spreadsheets, or dictionary mapping in Python. It relies on exact matches. You maintain a master list where "Github" equals "Software."
- Pros: It is 100% predictable. You know exactly why a transaction was labeled a certain way.
- Cons: It is brittle. It fails completely on new merchants or slight variations in naming (e.g., "Github.com" vs. "Github Inc").
Method 2: Heuristic (keyword/regex)
Heuristic methods add a layer of logic using string matching or Regular Expressions (Regex). instead of looking for an exact match, the logic might be: "If the string contains 'Delta' AND 'Air', classify as 'Travel'."
- Pros: This is more flexible than exact matching and can catch variations of a merchant name.
- Cons: It is prone to false positives. A rule looking for "Amazon" to classify as "Office Supplies" might accidentally misclassify "Amazon Web Services," which should be "Hosting/Infrastructure."
Method 3: Probabilistic (AI/LLM)
The newest contender involves using Large Language Models (LLMs) or machine learning classifiers. You send the transaction string and context to an AI model, and it predicts the category based on its training data.
- Pros: It handles ambiguity, unstructured text, and context incredibly well. It can often deduce that "Blue Bottle" is a coffee shop without being explicitly told.
- Cons: It can hallucinate or be inconsistent. Troubleshooting is difficult because it acts as a "black box" without a feedback loop.
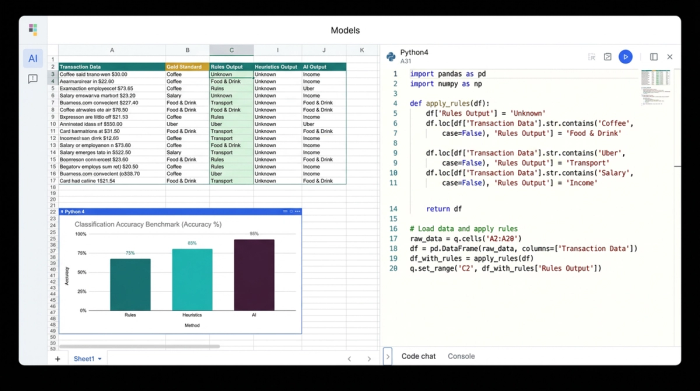
Benchmarking accuracy: the "cage match" experiment
In a standard spreadsheet, testing these three methods simultaneously is a nightmare of plugin management and formula errors. In a pure coding environment like a Jupyter notebook, the results are hard to visualize row-by-row. Quadratic bridges this gap, allowing an analyst to set up a benchmarking experiment directly in the grid.
The setup begins with input data—raw bank transactions—and a "Gold Standard" column. The Gold Standard is a set of transactions that have been manually labeled and verified as correct. This serves as the truth against which all methods will be judged.
The analyst then sets up three distinct columns to run the experiment:
1. Column A (Rules-Based): A Python cell runs a script that checks the merchant name against a defined dictionary of known vendors.
2. Column B (Heuristics): A second Python script applies keyword logic and Regex patterns to catch variations.
3. Column C (AI Classification): The analyst uses Python to call the OpenAI API directly from the spreadsheet, sending the merchant description to an LLM and asking for a category classification.
Because Quadratic supports native Python, these aren't hidden backend processes. The results populate the grid immediately. The analyst can see, side-by-side, that the Rules method missed "uber_eats_verification," the Heuristic method correctly caught it, and the AI method labeled it "Dining."
Measuring performance: precision, recall, and confusion matrices
Visual inspection is useful, but it doesn't scale. To truly trust an automated system, you need to measure precision and recall in classification.
Accuracy alone—simply saying "90% correct"—can be misleading. If you are looking for fraud or specific high-value categories, missing the few important ones (low recall) is a failure, even if the overall accuracy is high.
- Precision: Of all the transactions the model labeled "Software," how many were actually software? High precision means you can trust the label.
- Recall: Of all the actual "Software" transactions in the dataset, how many did the model manage to find? High recall means the model isn't missing things.
In Quadratic, the analyst can use a Python cell to calculate these metrics using libraries like scikit-learn. Beyond simple percentages, the analyst can generate a confusion matrix for business data. This is a heatmap visualization that highlights exactly where the models are getting confused.
For example, the confusion matrix might reveal that the AI model consistently mistakes "Advertising" spend for "Software" spend. This specific insight allows the analyst to adjust the prompt or the rules, rather than blindly hoping the model gets better.
The "human-in-the-loop" workflow
The reality of data work is that no method is 100% perfect. Automation should handle the easy 80% of the work, but you need a robust process for the difficult 20%. This is where the human-in-the-loop workflow becomes essential.
In this Quadratic workflow, the analyst creates a final "Consensus" column. Python logic compares the results from the three methods. If they all agree, the transaction is auto-categorized. If they disagree, or if the confidence score is low, the row is flagged for review.
Because Quadratic is a spreadsheet, the analyst can manually review these flagged rows, correct the category, and—crucially—feed that correction back into the system. By adding the corrected row to the "Gold Standard" list or the rules dictionary, the system learns. The next time the script runs, that edge case is no longer an error. This creates a virtuous cycle of improving classification accuracy.
Why this workflow beats standard Excel or pure Python
Standard Excel cannot easily run the API calls required for AI classification, nor can it generate confusion matrices without complex external plugins. You are often stuck with the deterministic method, manually fixing thousands of rows every month. This approach highlights why modern data tasks require more than traditional tools for effective spreadsheet automation.
Pure Python environments are powerful but lack the visual interface for the human-in-the-loop review. An analyst cannot easily scroll through a pandas DataFrame in a terminal to manually override a specific transaction label.
Quadratic offers the necessary middle ground. It provides the Python power to run the benchmarks, calculate the heavy metrics, and connect to AI APIs, while retaining the intuitive grid interface for manual review and data entry.
Conclusion
Effective Business category classification methods are rarely about choosing a single algorithm and walking away. They require a mix of automation and human judgment. By benchmarking rules against AI, measuring precision and recall, and maintaining a transparent review process, finance and data teams can turn a messy monthly chore into a streamlined, accurate pipeline.
Don't just pick a method and hope it works. Test your assumptions, visualize your errors, and build a system that gets smarter every time you use it.
Use Quadratic to benchmark and improve business category classification methods
- Combine and compare diverse classification methods: Seamlessly integrate rules-based logic, keyword heuristics, and AI models (like LLMs via API calls) directly within your spreadsheet grid.
- Automate multi-method evaluation: Run Python scripts in cells to apply different classification strategies to raw transaction data and see results populate instantly, side-by-side.
- Quantify model performance: Utilize native Python to calculate precision, recall, and generate confusion matrices, providing clear, data-driven insights into each method's accuracy.
- Build a self-improving "human-in-the-loop" system: Flag transactions for manual review when methods disagree, then feed those corrections back into your rules or Gold Standard to continuously refine your automation.
Transform your messy transaction data into structured insights. Try Quadratic.