
For many finance professionals, the "General Ledger" view is a source of daily frustration. You open your bank feed, expecting clear merchant names, but instead, you are greeted by a wall of cryptic text. A simple purchase at a supply store appears as WALMART ST#4923 ID:88293 POS:001, and a software subscription shows up as ADOBE *CREATIVE CLD DBL.
This noise makes categorization a nightmare. Most finance teams find themselves stuck in a difficult middle ground. Manual cleanup in spreadsheets is unscalable, boring, and prone to human error. On the other hand, enterprise engineering solutions involving Python scripts or natural language processing are often inaccessible to the average finance analyst or bookkeeper.
However, there is a better way. By utilizing assisted data cleaning in a tool like Quadratic, you can bridge the gap between manual entry and complex engineering. Cleaning transaction descriptions in financial data is not just about deleting text; it is about stripping noise, tokenizing useful data, and creating a reversible map that ensures your financial records remain audit-proof.
Why standard Excel methods fail at scale
When faced with messy data, the instinct for many advanced operators is to reach for familiar spreadsheet formulas. You might try nested SUBSTITUTE functions or complex LEFT and RIGHT combinations to trim strings. While these work for one-off tasks, they are incredibly brittle. If a vendor changes their transaction format slightly—moving the store ID from the end of the string to the middle—your entire formula chain breaks, requiring manual troubleshooting.
The alternative often used is the "Find and Replace" tool. While fast, this method poses a significant danger to financial data hygiene: it is destructive. If you globally replace "Amazon Marketplace" with "Amazon," you lose the original context forever. If an auditor later asks which transactions were third-party marketplace purchases versus direct supplies, you have no way to answer because the source data has been overwritten.
Ultimately, dirty data creates a common challenges in bank reconciliation. Accounting software relies on clean text to suggest matches. When descriptions are inconsistent, "auto-match" rates plummet, forcing you to manually review and categorize thousands of lines of transactions every month.
The 3-step workflow: stripping, tokenizing, and mapping
To solve this, we need a workflow that moves beyond simple deletion. By using Quadratic, which combines the familiarity of a spreadsheet with the power of Python, you can adopt a programmatic approach to parsing transaction strings without needing a full development environment.
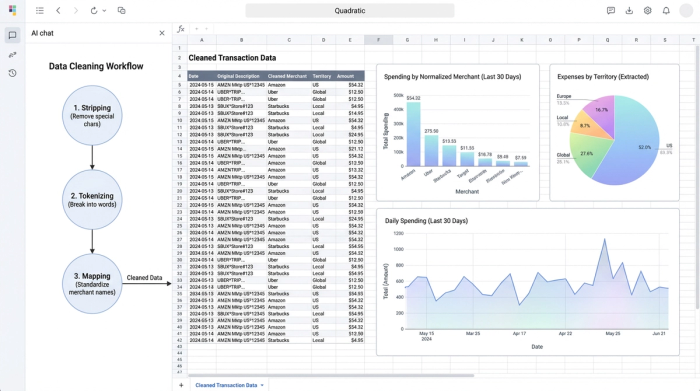
1. Stripping the noise
The first step is identifying the non-essential parts of the string. In most bank feeds, this includes store numbers, point-of-sale (POS) terminal IDs, and random hexadecimal codes that the bank uses for internal tracking.
In a standard spreadsheet, removing a variable pattern (like a store number that changes length) is difficult. In Quadratic, you can use Python to leverage Regular Expressions (Regex). This allows you to define a pattern—such as "any sequence of four numbers following a hashtag"—and strip it instantly across thousands of rows. This cleans the visual clutter without you needing to hunt down every specific store ID manually.
2. Tokenizing and extraction
Sometimes, what looks like noise is actually valuable data that is just in the wrong place. For example, a transaction string might include a project code, a location marker (like "SFO" or "NYC"), or a subscription ID.
Instead of deleting this information, the goal is to extract it into a new column. This process, often called tokenizing, allows you to keep the main description clean (e.g., just "Uber") while preserving the location data in a separate "Territory" or "Project" column. This improves your reporting capabilities, allowing you to slice expenses by location or project without cluttering the primary merchant field.
3. Normalization
The final step is merchant data normalization. This is the process of turning variations like AMZN MKTPLC, AMZN *PRIME, and AMAZON PAYMENTS into a single, standardized entity: Amazon.
By standardizing these names, you drastically improve the accuracy of pivot tables and categorization rules. When you upload this data back into your accounting software, the system recognizes "Amazon" immediately, applying the correct category automatically and saving hours of manual review.
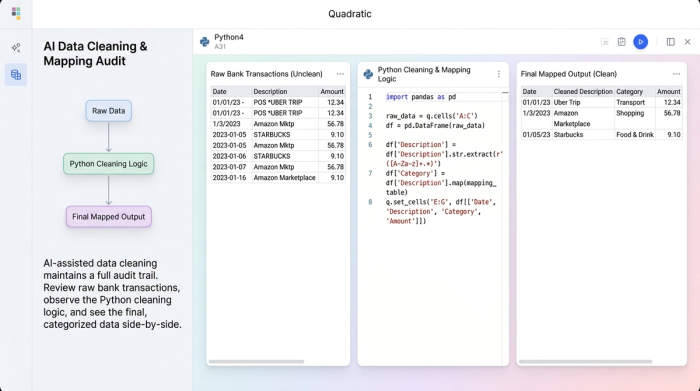
The secret weapon: the reversible mapping table
One of the biggest risks in data cleaning is the loss of the audit trail. If you change a transaction description, how do you prove what the original expense was?
The solution is the reversible mapping table. Instead of overwriting your data, you create a dedicated mapping structure.
- Column A: The original "dirty" string from the bank.
- Column B: The cleaned, normalized string.
This approach ensures audit compliance. You can always trace a clean transaction back to its original source. Furthermore, this method is future-proof. If you realize later that you mapped a vendor incorrectly, you simply update the mapping logic, and the change propagates through your analysis. You never touch or destroy the raw historical data.
In Quadratic, this workflow is particularly intuitive because of the infinite canvas. You can keep your raw data import, your cleaning logic (Python code), and your final mapping table side-by-side in one view. unlike traditional macros which hide logic in a "black box," everything in Quadratic is visible and auditable.
How to execute this in Quadratic
Executing this workflow is straightforward, even if you are not a coder.
First, you import your raw CSV or bank feed into Quadratic. The data populates the grid just like any other spreadsheet.
Next, you use a Python code cell to clean the specific column. You don't need to write a complex script from scratch; a single line of code is often enough to start. For example, to remove all numbers from a description column to help see the merchant names more clearly, you might use a simple command like:
df['clean_description'] = df['raw_description'].str.replace(r'\d+', '')
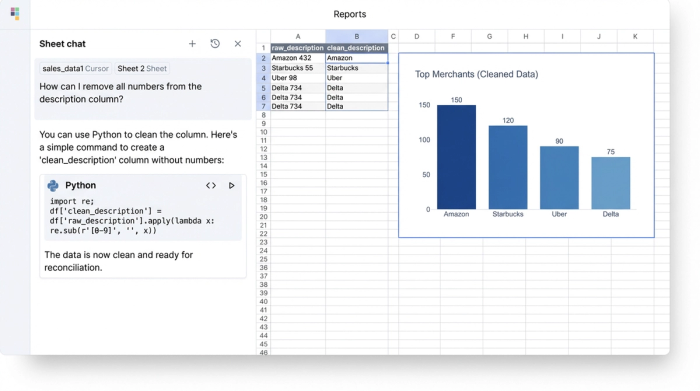
Finally, the outcome is a new dataset that is perfectly prepped for bank feed reconciliation. You can export this clean data to your accounting software or use it directly within Quadratic for analysis. The result is higher match rates, consistent categorization, and zero manual copy-paste errors.
Conclusion
Cleaning transaction descriptions in financial data does not require a data science degree, but it does require tools that are more capable than standard spreadsheets. By moving from manual cleanup to a structured, reversible workflow in Quadratic, you save hours on automated bank reconciliation and create a financial record that is both clean and audit-proof.
If you are tired of manually editing thousands of rows every month for month end reconciliation, try importing your messiest bank feed into Quadratic to see the difference.
Try Quadratic, the AI spreadsheet that does your work for you
Use Quadratic to clean transaction descriptions in financial data
- Quickly strip cryptic noise like store IDs and POS data from thousands of transaction descriptions using Python and regular expressions.
- Extract valuable embedded data (like project codes or locations) into separate columns for richer reporting, rather than deleting it.
- Standardize inconsistent merchant names (e.g., "AMZN MKTPLC" to "Amazon") to improve categorization accuracy and auto-match rates in accounting software.
- Maintain a complete audit trail with a reversible mapping table, linking every clean transaction back to its original raw data for compliance.
- Automate repetitive cleaning tasks with simple Python commands, eliminating manual spreadsheet errors and brittle formulas.
- Prepare financial data for faster, more accurate bank reconciliation and consistent month-end close.
Stop manually cleaning financial data. Import your bank feed and see how Quadratic transforms your workflow. Try Quadratic.