
In the high-stakes environment of an Emergency Department (ED), operational efficiency is directly tied to patient safety. When staffing levels fail to align with patient volume, the consequences are immediate and severe: Left Without Being Seen (LWBS) rates climb, provider burnout increases, and patient outcomes are put at risk. For operations analysts and directors, the challenge lies in predicting the unpredictable.
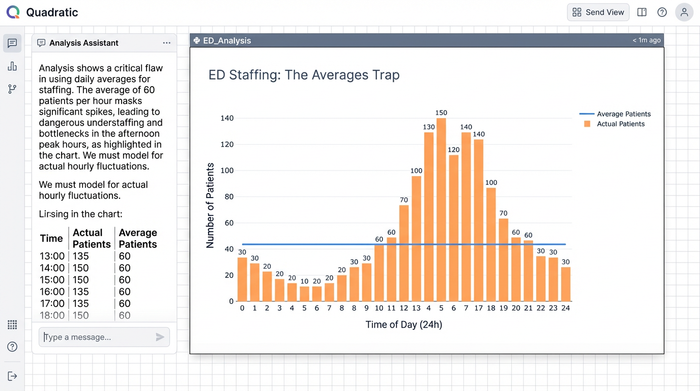
To solve this, modern capacity planners are moving toward dynamic, data-driven models that utilize historical throughput and forecasted arrival data. While these metrics are useful for high-level budgeting, they often smooth over the critical hourly variances that define life in the ED. A staffing plan based on daily averages cannot account for a Monday morning surge or a Friday night lull.
By combining direct SQL data ingestion, Python-powered analysis, and a familiar spreadsheet interface, analysts can build sophisticated models to optimize ED staffing without requiring a dedicated data engineering team. Quadratic provides the ideal environment for this transition.
Why traditional ED staffing models fail
If you search for solutions to capacity problems, you often find a polarized landscape. On one end, there are academic papers discussing complex queuing theory without offering practical tools to implement it. On the other, expensive enterprise software suites promise total efficiency but hide their methodologies behind "black box" algorithms and high price tags. This leaves most analysts stuck in the middle, trying to force standard spreadsheets to do work they weren't designed for.
The primary failure of spreadsheet-based planning is the "averages trap." Staffing an ED based on an average of 150 patients per day ignores the reality of flow. If 40 of those patients arrive between 11:00 AM and 3:00 PM, a static schedule will result in dangerous bottlenecks during the day and wasted resources overnight.
Furthermore, modern ED/EM/ER staffing is complex. It requires balancing different provider types—physicians (MDs/DOs), physician assistants (PAs), and nurse practitioners (NPs)—across various zones like Triage, Fast Track, and Acute Care. Standard spreadsheets struggle to layer these variables effectively, often leading to fragile files that break when variables change. While some facilities look for external EDS staffing solutions to fill gaps, the root cause is often an internal misalignment of capacity, not a lack of headcount.
The workflow: building a dynamic capacity model
The shift from static planning to dynamic modeling does not require learning a new proprietary software language. It simply requires a tool that brings your data and logic together. In Quadratic, analysts can ingest raw data and output a visual, actionable shift schedule in a single workspace. Here is how a dynamic model is built.
1. Ingesting historical & forecasted data
The foundation of any robust model is granular data. In a standard spreadsheet, pasting 500,000 rows of historical arrival data often leads to crashes or significant lag. Quadratic solves this by allowing you to connect directly to your hospital’s database (such as PostgreSQL, MySQL, or Snowflake) using built-in SQL connectors.
Instead of manual exports, you can write a SQL query directly within the spreadsheet to pull hourly patient arrival times, throughput data, and census history. This allows you to capture the specific "fingerprint" of your ED's volume, distinguishing between the heavy arrival patterns of a Monday morning and the distinct flow of a weekend night.
2. Analyzing demand with Python (no engineering team required)
Using the Pandas library, an analyst can clean the raw SQL data and apply logic to calculate staffing needs based on specific provider productivity targets (e.g., patients per hour). This allows for a more sophisticated analysis that aligns capacity with actual demand curves. You can script logic that accounts for seasonality or acuity levels, ensuring your ED staffing calculations reflect the reality of patient care rather than just accounting targets. Because this runs on Python, it handles complex math instantly, keeping the spreadsheet performant.
3. Visualizing the coverage gap
Numbers in a table are rarely enough to convince stakeholders to change a schedule. You need to visualize the misalignment between supply and demand.
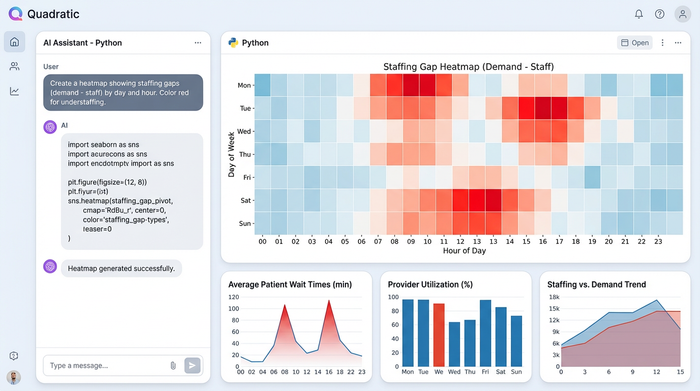
Using Python visualization libraries like Altair or Plotly within Quadratic, you can generate a heatmap of your coverage. Typically, this visual plots the time of day (00:00 – 23:00) on the X-axis and the day of the week on the Y-axis. You can set a color scale where red indicates understaffing (high risk of wait times) and blue indicates overstaffing (wasted budget). This visual instantly highlights where the current plan is failing, making the data accessible to medical directors and administrators who may not be analyzing the raw rows.
Generating optimized shift templates
With the analysis complete and the gaps visualized, the workflow moves from diagnosis to prescription. The goal is to turn the heatmap insights into a functional roster.
Using Quadratic’s infinite canvas, analysts can map out shift templates that specifically target the "red zones" identified in the heatmap. For example, if the Python model identifies a consistent surge between 2:00 PM and 10:00 PM on Mondays, you can design a "swing shift" specifically for that window. This allows for precise layering of shifts, ensuring overlap exactly where volume dictates.
This step is critical for financial stewardship. Before a hospital commits budget to an expensive ED staffing agency or searches for external help, they must ensure their internal resources are optimized. Often, a facility does not need more hours; they simply need the existing hours distributed more intelligently. By optimizing the internal roster first, reliance on premium labor and external EDS staffing contracts can be significantly reduced.
Operationalizing the results: forecasts & risk summaries
The final output of this workflow is a comprehensive operational tool, not just a one-off analysis. In Quadratic, the analyst produces a set of deliverables that drive daily operations:
- Staffing tables: A detailed breakdown of coverage by zone and provider type.
- Risk summaries: Python-generated reports that identify specific days with a high probability of elevated LWBS rates based on current schedules.
- Budget alignment: A dynamic check ensuring the new model respects operational cost constraints.
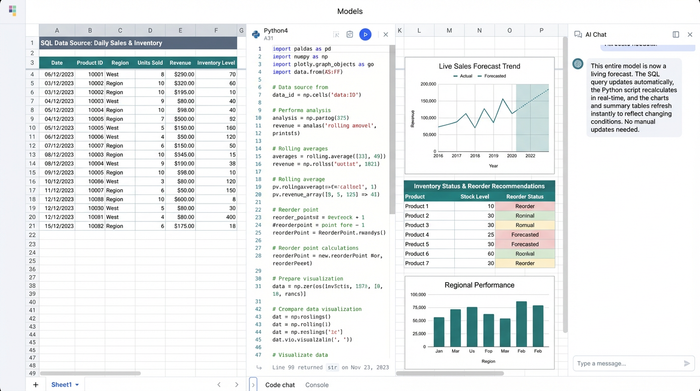
Because the model is built on live SQL queries and Python scripts, it is agile. When patient volume trends change—due to seasonality or a public health event—the analyst simply refreshes the query. The data updates, the Python calculations re-run, and the charts adjust automatically. This turns a static document into a living forecast.
Conclusion
Effective ED staffing is not about guessing or relying on "how we’ve always done it." It is about matching supply to demand with mathematical precision to ensure patient safety and operational sustainability.
Operations analysts and directors no longer need to choose between the limitations of standard spreadsheets and the rigidity of expensive enterprise software. This approach empowers you to optimize capacity, reduce wait times, and support your providers with a schedule that actually works.
Use Quadratic to Optimize ED Staffing
- Build dynamic models: Move beyond static averages to create hourly, data-driven staffing plans that adapt to patient flow.
- Integrate data seamlessly: Connect directly to your hospital database with SQL and apply Python for sophisticated demand analysis in a single workspace.
- Handle large datasets: Analyze hundreds of thousands of rows of historical patient data without performance issues or crashes.
- Visualize coverage gaps: Generate heatmaps with Python to instantly identify understaffed "red zones" and overstaffed "blue zones."
- Design optimized schedules: Create precise shift templates that target specific demand surges, reducing wait times and improving resource allocation.
- Ensure agility: Automatically refresh staffing models with new data, keeping schedules aligned with evolving patient volume trends.
- Reduce external costs: Optimize internal staff deployment to minimize reliance on expensive external staffing agencies.
Ready to build smarter ED staffing models? Try Quadratic.