Table of contents
- 3 standard ways to export GA4 data (and their limitations)
- Why analysts move data out of GA4
- The flexible workflow: analyzing exported data in Quadratic
- Advanced strategy: mixing historical and live data
- From raw data to stakeholder dashboards
- Conclusion
- Use Quadratic to Unlock Deeper Google Analytics Insights
Google Analytics 4 (GA4) is an incredibly powerful tool for data collection, but for many analysts, the native interface can feel like a cage. While it excels at gathering signals from websites and apps, the reporting features often obscure insights behind thresholding and sampling, and a rigid user interface. For marketing analysts and SEO specialists, the moment you need to perform complex calculations, join traffic data with internal sales logs, or visualize trends over several years, the native dashboard stops being helpful and starts being a hindrance.
To regain control, the best strategy is to export Google Analytics data out of the platform and into an environment where you have full ownership. However, simply downloading a file is not the end of the process; it is usually just the beginning of a messy data cleaning workflow. This article explores how to move beyond static downloads and establish a flexible, repeatable workflow using Quadratic—a modern Google Analytics spreadsheet that integrates Python and SQL—to clean, structure, and analyze your analytics data.
3 standard ways to export GA4 data (and their limitations)
Before diving into advanced analysis, it is important to understand the standard mechanisms available to get data out of the system. Most users rely on three primary methods, each with distinct pros and cons regarding data granularity and ease of use.
1. Standard reports (CSV/Excel)
The most accessible method is to open a standard report (like Traffic Acquisition) and click the "Share" button to download the file. This is the common path for users looking to export data from Google Analytics 4 to Excel for a quick meeting or ad-hoc check. While fast, this method is severely limited. It only exports the summarized data visible on the screen, meaning you lose the row-level details necessary for deep segmentation or root-cause analysis.
2. Explorations (raw data)
For more granular analysis, analysts build custom "Explorations." This allows you to define specific dimensions and metrics, making it the go-to method when you need to figure out how to export page view data from Google Analytics with specific event parameters attached. However, Explorations are plagued by data sampling and thresholding. If your dataset is too large or the user count is too low, GA4 may withhold data to protect privacy or improve performance, leaving you with an incomplete picture when you attempt to export raw data from Google Analytics.
3. BigQuery and API
The most robust option is linking GA4 to Google BigQuery or using the Analytics Data API to export GA4 data programmatically. This provides access to the raw data, unsampled event data. The downside is the technical barrier to entry. For many marketing teams, setting up a data warehouse and writing complex SQL queries in a cloud console is resource-intensive and disconnects the analyst from the familiar spreadsheet environment where they prefer to model data.
Why analysts move data out of GA4
The drive to perform a Google Analytics data export is rarely just about having a backup; it is about escaping the limitations of the platform to answer specific business questions.
One primary driver is data retention. Standard GA4 properties often limit data retention to 14 months, a detail further explained in their data retention policy. If you need to perform year-over-year analysis spanning several years, you must export and store that data elsewhere before it is deleted.
Another major factor is customization. GA4 exists in a vacuum; it does not know about your CRM data, your offline ad spend, or your inventory levels. To calculate true ROI or "profit per session," you must export data from Google Analytics and join it with these external sources to perform customer data analysis. Finally, flexibility is key. The "Comparisons" feature in GA4 is useful but rigid. Moving data into a spreadsheet environment allows for custom calculated metrics, complex filtering, and logic that simply cannot be defined in the native interface.
The flexible workflow: analyzing exported data in Quadratic
Once you have the data out, the challenge shifts to cleaning and structuring it. Traditional spreadsheets struggle here; Excel often chokes on large datasets, and manual copy-pasting introduces errors. Quadratic offers a different approach by combining the familiarity of a spreadsheet with the power of Python and SQL directly in the grid.
Centralizing the data
Instead of managing twelve different Excel files representing twelve months of traffic, you can import your CSV exports directly into Quadratic. Because Quadratic handles data more like a database than a traditional sheet, you can hold significantly more rows without performance lag. This creates a centralized "staging area" for your raw analytics data within a single workspace.
Standardizing dimensions and dates
A common pain point with a Google Analytics export data file is formatting. Dates often arrive as strings (e.g., "20231021"), and campaign names may have inconsistent casing. In a standard spreadsheet, fixing this requires complex formulas or manual find-and-replace tasks, illustrating the importance of robust data cleaning best practices.
In Quadratic, you can use Python directly in the cells to automate this cleaning. You can write a short script to parse date strings into actual datetime objects, normalize campaign names to lowercase, and categorize URLs using regex. This ensures your dimensions are standardized instantly. Because this logic is saved in code, it applies automatically to any new data you add to the sheet.
Reconciliation and joining
Data trust is built on reconciliation. Analysts often need to verify if the "Purchase" events in GA4 match the "Orders" in their internal database. Quadratic allows you to treat your spreadsheet data like SQL tables. You can write a SQL query within the sheet to join your exported GA4 data with your internal sales log based on Transaction ID. This reveals discrepancies immediately, allowing you to validate the accuracy of your tracking without leaving the spreadsheet.
Advanced strategy: mixing historical and live data
A major limitation of standard exports is that they are static. Once you download a CSV, the data is dead. However, reporting requires a view of both what happened last year (historical) and what happened yesterday (live).
Quadratic solves this by allowing you to mix data sources. You can maintain a static "Archive" table in your sheet containing historical data (perhaps from the old Universal Analytics era) and a "Live" table that pulls fresh data via an API connection or a recently uploaded export.
Using SQL, you can write a query that unions these two tables together. This creates a master dataset that feeds your charts and dashboards. You effectively bridge the gap between legacy data and current performance, enabling long-term trend analysis that would be impossible inside the GA4 interface.
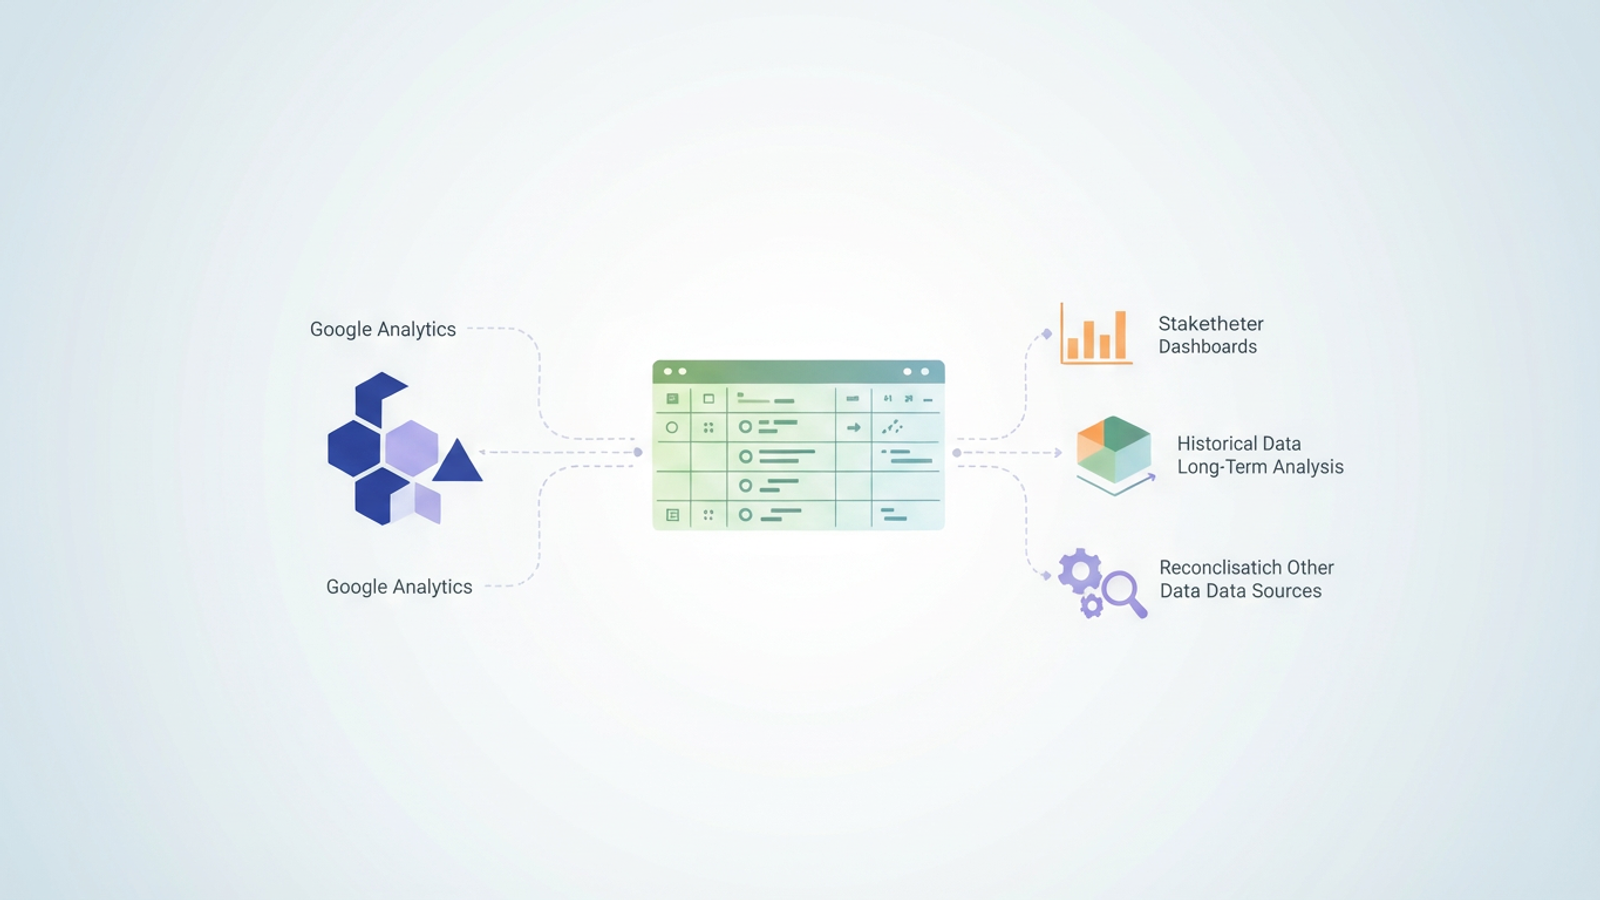
From raw data to stakeholder dashboards
The ultimate goal of this workflow is to present insights to stakeholders. Once your data is cleaned using Python and structured using SQL, you can use Quadratic’s built-in charting and formulas to create marketing data visualization.
The key advantage here is repeatability. In a traditional workflow, updating a monthly report involves opening the new export, copying columns, pasting them into the master sheet, and hoping the formulas do not break. In Quadratic, because your cleaning and joining logic is defined in code, the workflow is automated. When you bring in next month's export, the Python scripts and SQL queries re-run automatically, updating your custom dashboard Google Analytics and visualizations instantly.
Conclusion
Exporting data is only the first step in the analytics journey. The real value lies in what you can do with that data once it is free from the constraints of the native platform. By moving beyond simple CSV dumps and adopting a workflow that leverages Python and SQL within a spreadsheet, you turn raw numbers into a structured, flexible asset.
Don't let your data sit dormant in static files. Whether you need to reconcile transaction discrepancies or build a multi-year performance view, using a tool like Quadratic allows you to learn how to export Google Analytics data and immediately transform it into actionable business intelligence.
Use Quadratic to Unlock Deeper Google Analytics Insights
- Centralize and manage large GA4 exports in a single, high-performance spreadsheet, overcoming traditional file size limitations.
- Automate data cleaning and standardization for inconsistent formats (like dates or campaign names) using Python directly in the grid.
- Join GA4 data with external sources such as CRM or sales logs using SQL to calculate true ROI and custom metrics.
- Bridge historical and live data by combining past archives with fresh exports for comprehensive, multi-year trend analysis.
- Build repeatable, automated workflows where cleaning, joining, and reporting logic instantly updates with new data.
- Create custom dashboards and visualizations that go beyond GA4's rigid interface, tailored to your specific business questions.
Ready to unlock the full potential of your Google Analytics data? Try Quadratic.