
For many digital marketers and growth analysts, the migration to GA4 felt less like an upgrade and more like a barrier to insight. While the platform is powerful at collecting event-based data, the native interface often feels rigid and unintuitive interface. Simple questions that used to take seconds to answer now require navigating complex "Explore" tabs or dealing with aggressive data sampling. Consequently, the search for a reliable google analytics spreadsheet solution has skyrocketed. Professionals want their data out of the proprietary interface and into a flexible grid where they can actually work with it.
However, the standard solution—exporting a static CSV—is fundamentally flawed. A CSV is a snapshot in time; the moment you download it, the data is stale. To build true intelligence, you need a live analysis environment. This is where Quadratic changes the workflow. By combining the familiarity of a spreadsheet with the power of Python and SQL, Quadratic allows you to build a dynamic pipeline. You don't just view the data; you connect to it, clean it, and analyze it in a single, infinite workspace.
Why move GA4 data to a spreadsheet?
The primary driver for moving google analytics to spreadsheet environments is flexibility. Spreadsheets act as an escape hatch from the limitations of the GA4 user interface. They allow for ad-hoc analysis, custom groupings, and calculations that are either impossible or frustratingly difficult to configure inside Google's native tools.
Beyond interface fatigue, data retention is a critical technical reason to own your data in a sheet. GA4 has introduced stricter data retention limits, often deleting user-level data after 2 or 14 months depending on your settings. By syncing this data into a spreadsheet, you create a historical archive that persists regardless of Google’s retention policies, allowing for year-over-year analysis that spans longer timeframes.
Perhaps the most overlooked reason is the "middle layer" gap. Most tools treat data transfer as a simple copy-and-paste job. But GA4 data is messy. It often arrives in nested, JSON-like structures where multiple parameters are packed into a single cell. Standard spreadsheets struggle here, forcing you to use fragile text-to-columns features. A code-enabled spreadsheet allows you to act as a data engineer, using this middle layer to parse, flatten, and clean the data programmatically before you ever try to visualize it.
The landscape: add-ons vs. native connectors
When looking for a solution, most users initially gravitate toward a google analytics spreadsheet add on. Tools like Supermetrics or the native Google Sheets connector are popular because they are easy to install. However, they come with significant trade-offs.
Add-ons operate within the constraints of a traditional spreadsheet. They often hit row limits quickly, causing reports to truncate. More importantly, once the data is in the sheet, cleaning it requires complex, fragile formulas. If the data structure changes slightly, your entire chain of VLOOKUP or INDEX/MATCH formulas can break. Furthermore, premium add-ons can become surprisingly expensive as you scale the number of accounts or rows you need to process.
The alternative "pro" route is sending data from GA4 to BigQuery and then to a spreadsheet. While robust, this requires SQL knowledge and Google Cloud Platform configuration, creating a high technical barrier.
Quadratic offers a strategic middle ground. It provides the direct, synced connection you would expect from an add-on, but it includes the data processing power usually reserved for data warehouses. You can pull live data without row limits and use Python or SQL directly in the grid to clean it, eliminating the need for fragile formula chains.
Tutorial: building a dynamic GA4 report in Quadratic
This workflow demonstrates how a real user—a digital marketer—can move beyond static exports to build a live, auto-updating report. The goal is to track traffic trends, analyze campaign ROI, and identify high-bounce landing pages without constantly re-exporting files.
1. Connect and sync live data
The first step is establishing a connection. Instead of manually downloading a file, you use Quadratic’s built-in data connectors to link directly to your Google Analytics account. You select your property, date range, and the dimensions and metrics you need (such as date, session source, medium, campaign, and event counts).
Crucially, this is an automated connection. Unlike a static CSV, you can configure this query to refresh. When you open your spreadsheet next week, the data updates automatically to include the latest traffic numbers. This shifts your role from data entry to data analysis.
2. Flattening dimensions
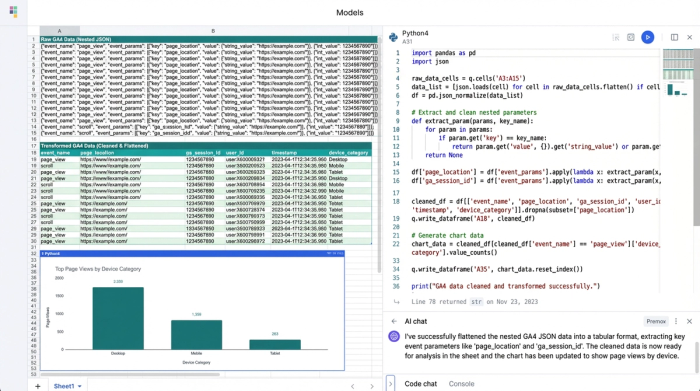
This is where the "data utility" capability of Quadratic shines. GA4 data is often hierarchical. For example, a single session might have multiple event parameters nested inside it. In a standard spreadsheet google analytics workflow, this nested data is a nightmare to parse.
In Quadratic, you can use a Python cell to "flatten" these dimensions. With a few lines of code, you can transform nested JSON structures into a clean, tabular format. You can parse dates, apply GA4 default channel grouping to categorize traffic sources, and rename obscure metric headers into readable columns. Because this is done in code, it is resilient. If the data order changes, the script still finds the correct keys, ensuring your report doesn't break.
3. Analyzing campaign & landing page performance
With clean data in place, you can move to the specific analyses required for the use case:
- Traffic trends: You can write a SQL query against your cleaned data frame to group sessions by date. This allows you to instantly see spikes or dips in traffic over time without wrestling with pivot tables.
- Campaign analysis: By grouping data by
session_sourceandcampaign_name, you can calculate conversion rates. Python allows you to perform complex arithmetic across columns—such as dividing total revenue by ad spend—to derive distinct ROI figures for every campaign. - Landing pages: To identify underperforming content, you can filter for pages with high bounce rates or low engagement times. This isn't just a static report; it is a queryable dataset. You can filter the results to show only pages with more than 1,000 views, ensuring statistical significance in your analysis.
Creating reusable templates
One of the biggest frustrations with Excel-based reporting is that it is hard to replicate. If you have a new client or a new website property, you often have to rebuild the report from scratch or carefully copy-paste formulas that might reference the wrong cells.
Because Quadratic handles data transformation via code, your work effectively becomes a reusable google analytics spreadsheet template, such as a marketing funnel template. Once you have written the Python script to clean the data and the SQL queries to aggregate it, you can duplicate the sheet and simply point the connector to a different GA4 property ID. The entire analysis pipeline—cleaning, calculations, and tables—runs automatically on the new data. This turns a custom analysis into a scalable product for your team or agency.
Visualizing the data for stakeholders
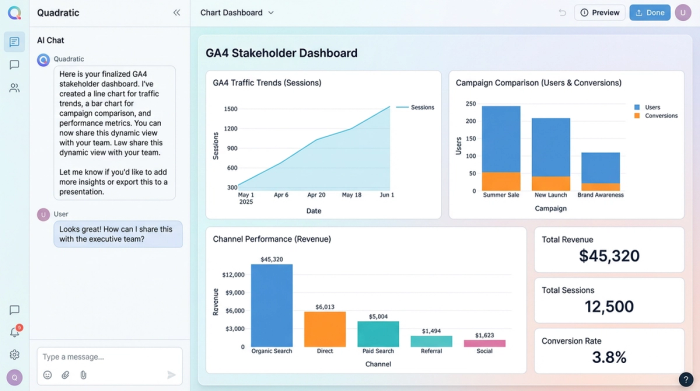
While analysts love rows and columns, stakeholders need effective marketing data visualization. The final step in this workflow is converting your flattened, analyzed data into a visual story.
Quadratic allows you to generate charts directly from your data frames. You can create time-series line charts to visualize traffic trends or bar charts to compare campaign performance side-by-side. Because these charts are powered by the live data connection, they update automatically as fresh data arrives. You can deliver a custom GA4 dashboard that answers the "what happened" questions at a glance, while keeping the granular "why it happened" data available in the grid for deep dives.
Conclusion
The shift from GA4’s native interface to a spreadsheet shouldn't feel like a step backward into manual data entry. By moving from static exports to live connections, you reclaim control over your analytics. A google analytics spreadsheet built in Quadratic does more than just display numbers; it provides a workspace where you can engineer, clean, and analyze data with the precision of a developer and the speed of a marketer. Stop struggling with fragile add-ons and start exploring your data in an environment designed for modern analysis.
Use Quadratic to Build Dynamic GA4 Reports & Analysis
- Connect directly to live GA4 data: Eliminate static CSV exports with automated, refreshing connections for always-current insights.
- Clean and transform messy GA4 data: Use Python to programmatically parse and flatten complex, nested GA4 structures into a clean, tabular format.
- Overcome data retention limits: Create a persistent historical archive of your GA4 data for long-term trend analysis, independent of Google's policies.
- Perform advanced analysis with code: Apply Python and SQL directly in your google analytics spreadsheet for robust campaign ROI calculations, traffic trend analysis, and landing page performance.
- Automate and reuse your workflows: Build analyses as reusable templates that automatically update and adapt for new GA4 properties or clients.
- Visualize insights for stakeholders: Generate live, auto-updating charts and custom dashboards directly from your analyzed data, making reporting effortless.
Start building more powerful GA4 reports today. Try Quadratic.