Table of contents
- The "single source of truth" struggle
- Prerequisites: naming conventions and UTMs
- Step-by-step: building the blended model in Quadratic
- Facebook Audience Insights vs Google Analytics comparison
- Moving beyond reporting: analysis and action
- Conclusion
- Use Quadratic to unify Facebook and Google Analytics data for true ROI
Every performance marketer knows the "Measurement Maze." You open Facebook Ads Manager, and it reports a 500% ROAS on your latest prospecting campaign. You feel great until you open Google Analytics 4 (GA4), which attributes a fraction of that revenue to the same campaign. Who is lying? Usually, neither. They are simply speaking different languages, often due to varying approaches to marketing attribution models.
Relying on platform-specific data creates data silos that make it impossible to see the true efficiency of your spend. If you optimize solely based on Facebook’s generous view-through attribution, you risk overspending on retargeting. If you optimize solely on Google’s last-click model, you risk killing top-of-funnel campaigns that drive awareness.
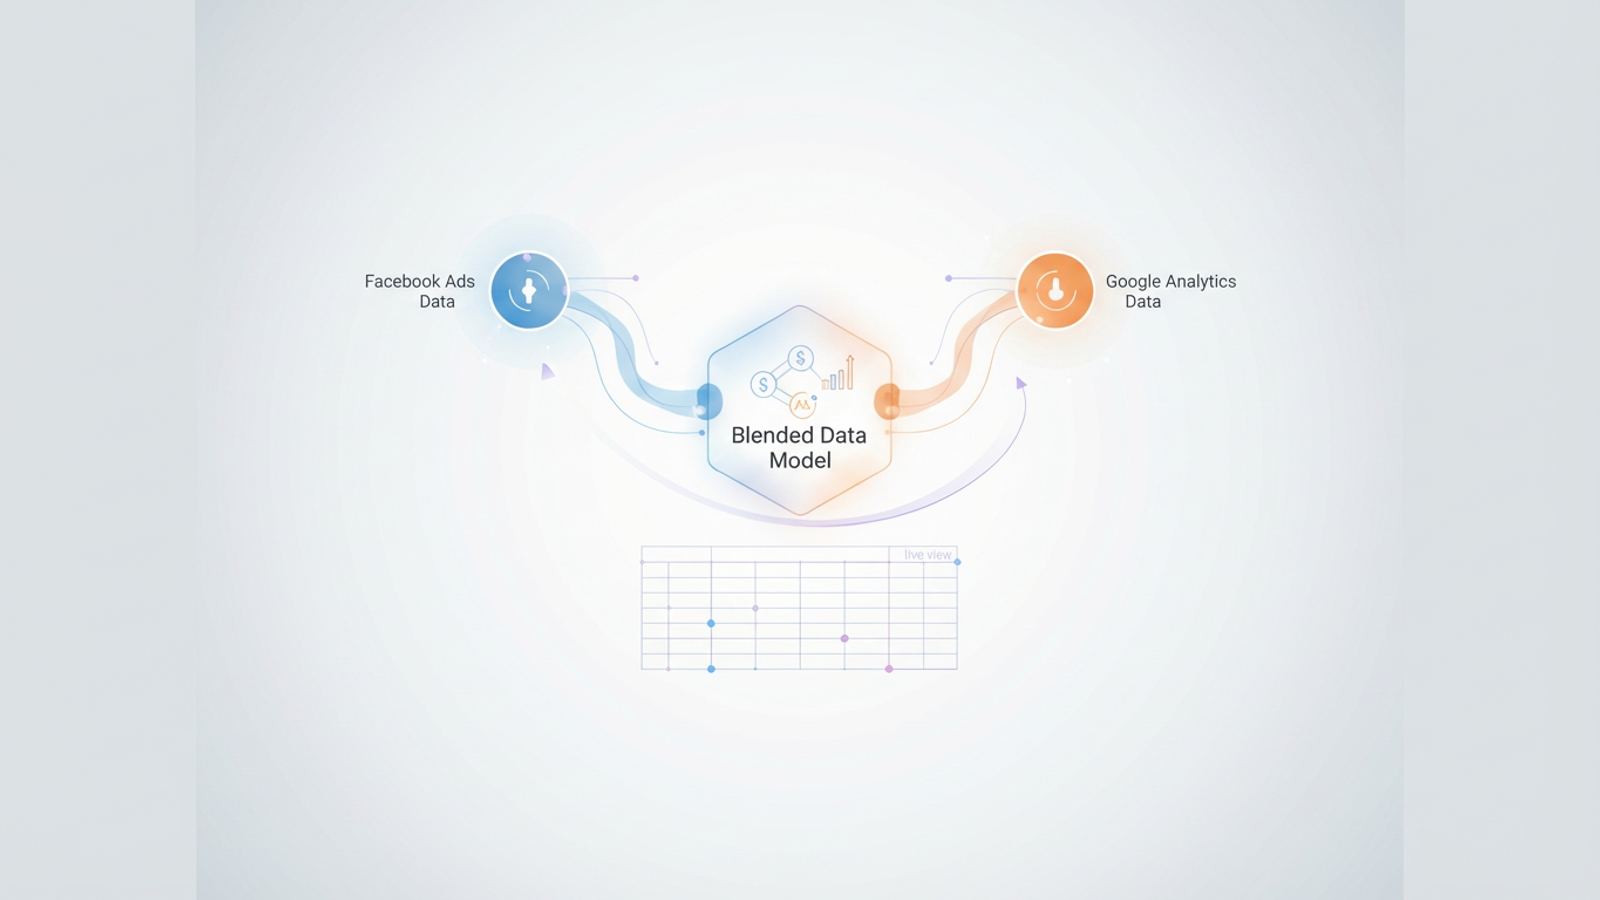
To solve this, modern acquisition managers are moving toward a blended reporting model. This approach combines cost data from ad platforms with truth-based conversion data from analytics tools. While many attempt this in standard spreadsheets, the manual export-import cycle is prone to error. This is where Quadratic changes the workflow. By offering an infinite canvas that combines the familiarity of spreadsheets with the power of Python and SQL, Quadratic allows you to merge Facebook Insights Google Analytics data flexibly, creating a live view of your marketing performance.
The "single source of truth" struggle
Blending data sounds simple in theory but is notoriously difficult in practice. The fundamental problem is that Facebook tracks people (User IDs) across devices, while Google Analytics primarily tracks cookies and sessions.
Most marketers find themselves stuck in a gap between two imperfect solutions. On one side, there are rigid dashboarding tools like DashThis or Google Looker Studio. These are great for visualization but terrible for modeling; you cannot easily edit the underlying logic or create complex custom calculated metrics. On the other side is complex data warehousing (Snowflake, Redshift) combined with BI tools (Tableau), which requires data engineering resources that most marketing teams do not have.
Quadratic provides the middle ground. It allows you to pull in live data and use Python or SQL to build a model that reflects your specific business logic. You aren't forced into a pre-set template, and you don't need a degree in data engineering to join two datasets together.
Prerequisites: naming conventions and UTMs
Before you can blend data in Quadratic—or any tool—you need a common identifier to join your datasets. In database terms, this is your "Primary Key." For marketing data, this key is almost always the Campaign Name.
If your naming conventions are messy, your blended model will break. To prepare for a successful blend, ensure you are following consistent UTM parameters and other best practices:
- Consistent UTMs: The
utm_campaignparameter on your Facebook ads must match the Campaign Name in Facebook Ads Manager exactly. If Facebook says "Prospecting_US_Fall" but your UTM says "prospecting-us-fall," the data will not merge automatically. - Structured Naming: Adhere to a strict naming convention, such as
Channel_Geo_Objective_Date. This allows you to parse campaign names later to group performance by geography or objective.
Strictly formatted data allows for instant mapping in Quadratic. When your keys match, you can use simple SQL joins or Python merge functions to combine datasets instantly, rather than spending hours manually cleaning CSV files.
Step-by-step: building the blended model in Quadratic
Once your data hygiene is in order, you can build a blended reporting model that updates automatically. Here is how a paid acquisition manager can set this up within Quadratic.
1. Syncing data sources
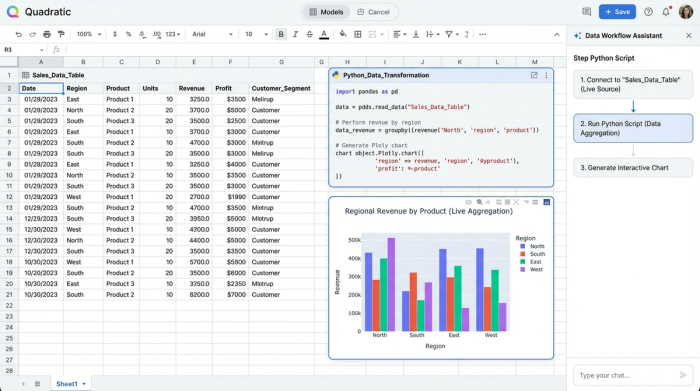
The first step is moving away from static CSV exports. In a standard spreadsheet, you have to download reports from Facebook and Google every morning and paste them into tabs. In Quadratic, you can connect directly to live data sources.
You can use Quadratic’s integrations or Python libraries to pull live data from GA4 (fetching metrics like sessions, users, and conversions) and Facebook Ads (fetching spend, impressions, and clicks). Because Quadratic supports Python natively in the grid, you can write a script to fetch yesterday’s data automatically. This ensures your analysis is always based on the most current numbers without manual intervention.
2. Mapping campaign data
With both datasets live in your sheet, the next step is the "Join." You need to map the Facebook "Campaign Name" to the GA4 "Session Campaign."
In a traditional tool, if a campaign name has a slight typo, the data is lost or categorized as "Other." In Quadratic, you can use Python to handle the modeling gap. You can write a script that performs fuzzy matching to catch slight naming errors, or you can use SQL to group campaigns together.
For example, you might want to see performance not just by individual campaign, but by funnel stage. You can write a query that groups all campaigns containing the word "Retargeting" from Facebook and matches them with corresponding traffic in GA4, giving you an aggregate view even if the individual campaign names don't match perfectly 1:1.
3. Calculating blended metrics
Once the data is joined, you can move beyond the default metrics provided by the platforms and calculate the KPIs that actually matter to your business. This is where you solve for cross-channel attribution.
Common blended metrics you can build in Quadratic include:
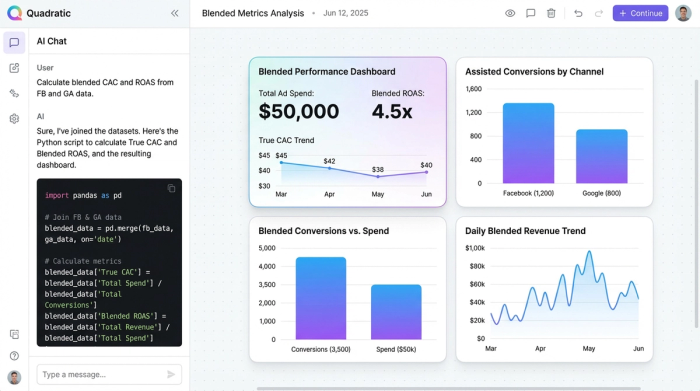
- True CAC: Calculated as (Total Facebook Spend) / (Total GA4 Conversions). This tells you how much you paid to acquire a customer according to your site's backend, rather than the ad platform's pixel.
- Calculated as (Total GA4 Revenue) / (Total Facebook Spend), Blended ROAS is often the most honest view of campaign efficiency. This is often the most honest view of campaign efficiency.
- Assisted Performance: By comparing the raw conversion numbers from Facebook against GA4, you can calculate the "Assisted" lift. If Facebook claims 100 conversions and GA4 only sees 20 last-click conversions, the delta of 80 represents conversions where Facebook played a role but wasn't the final touch.
Facebook Audience Insights vs Google Analytics comparison
Understanding the discrepancy between platforms is vital for interpreting your blended model. A Facebook Audience Insights vs Google Analytics comparison reveals fundamental differences in how success is measured.
Facebook operates on a people-based tracking model. It usually defaults to a generous attribution window (often 1-day view, 7-day click). If a user sees your ad on Instagram mobile, scrolls past, but purchases three days later on a desktop, Facebook claims credit.
Google Analytics operates on a session-based model. By default, it often uses a last-non-direct click model. In the scenario above, GA4 would attribute the sale to "Direct" or "Organic" because it didn't see the ad click.
The goal of blended reporting in Quadratic isn't to force these numbers to match—they never will. The goal is to view them side-by-side to understand incrementality. When you see a campaign with high Facebook ROAS but low GA4 revenue, it suggests that the campaign is excellent at generating demand (top of funnel) but relies on other channels to close the sale.
Moving beyond reporting: analysis and action
The ultimate value of Quadratic lies in moving from passive reporting to active analysis. Because you are working in a live canvas, you aren't just looking at a static PDF or a locked dashboard. You can interact with the data to answer specific questions.
You can filter and query your blended model to surface actionable insights immediately:
- Identify Clickbait: Query for campaigns with high Facebook clicks but abnormally low GA4 time-on-site. This indicates ads that are driving traffic but failing to engage users.
- Budget Allocation: Sort by the highest discrepancy between Facebook ROAS and Blended ROAS. If a campaign looks profitable on Facebook but has near-zero impact in Google Analytics, it might be cannibalizing organic traffic rather than driving new growth.
With these insights, you can immediately adjust bid caps, kill inefficient ad sets, or scale campaigns that show strong blended performance, closing the loop between analysis and action.
Conclusion
Tools like Google Looker Studio or Tableau are excellent for visualizing data that is already perfect. However, marketing data is rarely perfect. It requires cleaning, joining, and modeling logic to bridge the gap between ad spend and site revenue.
Quadratic offers the flexibility to build this logic yourself. By combining the ease of a spreadsheet with the power of Python and SQL, you can build a blended reporting engine that provides a clear, honest view of your ROI. Stop wrestling with CSV exports and disparate data silos, and start building your blended model in Quadratic today.
Use Quadratic to unify Facebook and Google Analytics data for true ROI
- Connect live Facebook Ads and Google Analytics data: Ditch manual CSV exports for automated, real-time data syncing directly in your spreadsheet.
- Build custom attribution models: Use Python or SQL in the grid to create precise campaign joins and custom logic, overcoming platform attribution discrepancies.
- Calculate true blended ROI metrics: Define and track KPIs like True CAC and Blended ROAS based on your business logic, not just platform-reported numbers.
- Automate data cleaning and mapping: Handle inconsistent campaign naming conventions with Python scripts or SQL joins for accurate data blending.
- Move from passive reports to actionable insights: Interactively query your blended data to identify underperforming ads or allocate budget more effectively, all within the same canvas.
Ready to get an honest view of your marketing performance? Try Quadratic.