
For years, digital analysts relied on the simplicity of Universal Analytics. If you needed to break down traffic by source, medium, and landing page, you could whip up a custom report in seconds. However, with the migration to Google Analytics 4 (GA4), that familiar workflow has changed. The quick, ad-hoc tables of the past are now buried within a section called "Explorations," leaving many marketing operations analysts and SEO specialists frustrated by the extra friction.
If you are looking to build a Google Analytics pivot table, you have likely realized that the native interface is powerful but rigid. While you can build these reports inside GA4, the process often feels disconnected from the flexibility required for deep analysis. You cannot easily add custom formulas, calculate arbitrary conversion rates, or manipulate the data without hitting administrative walls.
This guide will walk you through the native method of creating a pivot table in GA4 using Explorations. Then, it will introduce a more dynamic workflow using Quadratic—an AI-powered spreadsheet that connects directly to your data. This approach allows you to bypass the limitations of the GA4 interface and perform live, ad-hoc analysis using the spreadsheet skills you already possess.
How to create a pivot table in Google Analytics 4 (native method)
To replicate the functionality of a classic pivot table within the GA4 interface, you must use the "Explore" tab. This area of GA4 is designed for more granular data analysis than the standard "Reports" snapshot. Here is how to set up a basic pivot table Google Analytics view to analyze your traffic and performance metrics.
First, navigate to your GA4 property and click on the Explore icon in the left-hand navigation bar. From the template gallery, select Blank. While there are pre-made templates, starting from scratch gives you the most control over your rows and columns. This "Free-form" exploration is the direct equivalent of a pivot table.
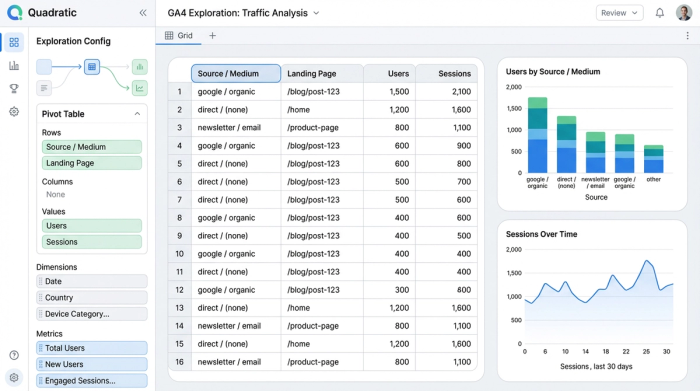
Once inside the builder, look at the "Visualization" row in the settings column and ensure the Table icon is selected. Next, you need to define your variables. Click the plus symbol next to Dimensions to search for and import categories like "Session source / medium," "Landing page + query string," or "Device category." Do the same for Metrics, selecting data points like "Total users," "Sessions," and "Conversions."
Finally, drag and drop your selected Dimensions into the Rows section and your Metrics into the Values section. The canvas on the right will populate with your data. You can now nest rows (e.g., viewing Landing Pages under specific Sources) to drill down into performance. This provides a functional GA4 pivot table tutorial for basic reporting needs.
The limitations of GA4 explorations
While the native exploration tool is useful for quick checks, it often creates a ceiling for analysts who need to do serious data manipulation. The moment you need to go beyond standard reporting, the interface begins to fight you.
One of the most significant pain points is the friction surrounding custom calculated metrics. In a spreadsheet, if you want to calculate a specific conversion rate or average order value that GA4 doesn't provide by default, you simply type a formula into a cell. In GA4, creating these metrics often requires Admin access to configure property-wide settings. You cannot simply create an ad-hoc calculation for a single report on the fly.
Furthermore, analysts frequently run into data thresholding and sampling issues. If your dataset is large, GA4 may rely on a sample of your data to load the exploration quickly, which can skew the accuracy of granular reports.
Because of these restrictions, most analysts eventually hit a "dead end" where they are forced to export their exploration. They click "Export to Google Sheets" or download a CSV. The problem is that the moment you export, your data is stale. You are no longer looking at live analytics; you are looking at a snapshot from the past. If you need to update the report next week, you have to repeat the entire manual process.
A better workflow: live Google Analytics pivot tables in Quadratic
There is a modern alternative that bridges the gap between the live data of GA4 and the flexibility of a spreadsheet. Quadratic allows you to bring your analytics data directly into an infinite canvas where you can build live pivot tables without the restrictions of the GA4 UI.
This workflow is particularly valuable for the marketing operations analyst who needs to view complex dimensions—such as source/medium, landing page, campaign, device, and geography—side-by-side. Instead of fighting with drag-and-drop menus or exporting static CSVs, you can work with a live data connection in a familiar environment.
Step 1: syncing GA4 data (no more CSVs)
The first step in Quadratic is establishing a direct link to your data. Rather than exporting a file, you use the built-in Google Analytics integration to sync your property. This creates a live pipeline.
Unlike the traditional export method, where data dies the moment it hits the spreadsheet, a Quadratic connection remains active. You can configure the query to pull the exact dimensions and metrics you need. Because the data is piped directly into the grid, you eliminate the risk of version control errors or copy-paste mistakes. You have the raw materials for your analysis ready to go, and they stay current automatically.
Step 2: building the pivot view
Once your data is synced, you can structure your analysis. In the GA4 native interface, you are limited by the marketing data visualization settings of the "Free-form" exploration. In Quadratic, you are working in a true google analytics spreadsheet environment.
You can organize your data by Source/Medium, Landing Page, or any other dimension just as you would in Excel or standard sheets, but with the added power of Python and SQL integrated directly into the grid. You are not forced to view the data exactly how Google thinks you should see it. If you want to pivot the data to see which landing pages are performing best across different device types, you can construct that view using standard pivot logic or simple SQL queries right within the sheet.
Step 3: ad-hoc calculations and ranking
The true power of this workflow emerges when you need to perform calculations that are difficult or impossible in GA4 explorations.
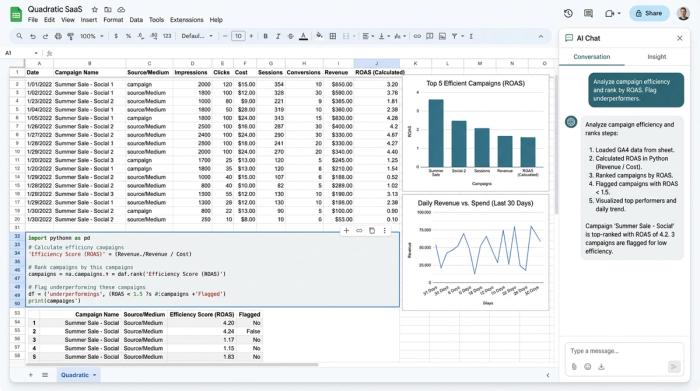
Consider the challenge of calculating Period-over-Period (PoP) analysis deltas. In GA4, visualizing a clean Month-over-Month percentage change for specific custom metrics can be incredibly cumbersome. In Quadratic, this is a simple formula. You can calculate the delta between two timeframes instantly, or use Python to write a script that automatically flags campaigns where the CPA has increased by more than 10%, a key feature of an ai dashboard ga4.
Ranking performance is equally fluid. If you want to filter your campaigns to show only those with high conversion volume but low efficiency, you can do so immediately. You can also create custom aggregations—grouping specific landing pages together into "content buckets" that don't exist in your GA4 configuration—without needing to ask a developer to change tracking parameters. This allows for rapid, ad-hoc segmentation that matches the speed of your questions.
Why analysts choose the spreadsheet approach
When comparing the two workflows, the distinction becomes clear. The native GA4 method is effective for quick, surface-level checks or standard reporting where the metrics are pre-defined. However, it is rigid. It requires you to conform to the tool's logic.
The Quadratic approach is chosen by analysts who need deep, flexible analysis. It combines the "live" nature of the GA4 UI with the infinite adaptability of a spreadsheet. You gain the ability to use Python for advanced data cleaning, SQL for querying your datasets, and standard formulas for quick math—all without losing the connection to the source data. You do not have to choose between having up-to-date numbers and having the freedom to analyze them; you get both.
Conclusion
The Google Analytics pivot table—known natively as a Free-form exploration—is a fundamental tool for digital marketers. Knowing how to build one in the GA4 interface is a necessary skill for quick insights. However, for the complex, custom dashboard google analytics reporting that drives strategy, the native tools often impose too many limitations.
If you are tired of exporting CSVs every week or struggling to create calculated metrics inside a rigid menu system, it is time to change your workflow. By bringing your GA4 data into Quadratic, you can build the exact reports you need with live data, infinite flexibility, and the full power of a modern technical spreadsheet.
Use Quadratic to build custom GA4 pivot tables
- Connect directly to live GA4 data: Eliminate manual CSV exports and always work with current analytics, avoiding stale data.
- Build flexible pivot tables: Freely arrange and analyze GA4 dimensions and metrics (like source/medium, landing page, device) in a familiar spreadsheet environment, unrestricted by GA4's UI.
- Perform any ad-hoc calculation: Easily create custom metrics, period-over-period analysis, and complex formulas using Python, SQL, or standard spreadsheet functions, without needing admin access.
- Bypass GA4 data limitations: Avoid data thresholding and sampling issues by pulling your full dataset directly into the grid for accurate, granular insights.
- Automate your GA4 reporting: Set up queries once to ensure your pivot tables update automatically, saving time on repetitive analysis.
Ready to create powerful, live GA4 pivot tables? Try Quadratic.