
Every investor searches for the Holy Grail of diversification: a portfolio that can weather any storm. When the broader market dips, you want specific assets to hold steady or, ideally, rise. This is the essence of finding negatively correlated stocks. However, achieving true diversification is difficult because asset correlations are not static. They shift during market cycles, liquidity crunches, and geopolitical crises.
A static list of "recession-proof stocks" found on a blog post from two years ago is worse than useless; it is dangerous. Yesterday’s hedge often becomes today’s risk. To build a truly resilient portfolio, you need more than a list. You need a dynamic workflow that allows you to analyze relationships in real-time, filter out sectors based on current macro conditions through macroeconomic analysis, and overlay external economic data.
In this article, we will move beyond static definitions. We will walk through a live analysis workflow using Quadratic to identify negatively correlated stocks. We will specifically look at how to exclude interest-rate-sensitive sectors like Financials and Utilities while incorporating geopolitical risk data to find assets that actually protect your capital when it matters most.
Understanding negative correlation in modern markets
Before diving into the data, it is vital to define what we are looking for. In statistics, the correlation coefficient ranges from -1 to +1. A correlation of +1 means two assets move in perfect lockstep. A correlation of 0 means their movements are unrelated. A correlation of -1 means they move in perfectly opposite directions.
Investors often ask, are stocks and bonds negatively correlated? Historically, the answer has been yes. For decades, high-grade bonds were the standard hedge against equity volatility. When stocks fell, investors fled to the safety of bonds, driving yields down and prices up. However, this relationship is not a law of physics. In high-inflation environments, stocks and bonds can become positively correlated, falling together as central banks raise rates. This was painfully evident in 2022, where the traditional 60/40 portfolio offered little protection.
Finding assets negatively correlated to stock market movements is easier when looking outside of equities. Gold, the VIX (volatility index), and managed futures often serve this purpose. However, finding stocks that are negatively correlated to other stocks is much harder. It requires rigorous data mining to identify specific companies or industries—such as defense contractors or discount retailers—that thrive when the rest of the S&P 500 struggles.
Why static lists fail (and why you need a workflow)
If you search for negative correlation stocks examples, you will likely find articles listing consumer staples or gold miners. While these may have been accurate at the time of writing, market drivers change. A gold miner might be a good hedge against inflation but a poor hedge against a liquidity crisis. Relying on a static list ignores the nuance of the current economic environment.
Consider a specific, sophisticated use case. Imagine a portfolio manager looking to hedge against rising geopolitical instability. They want to find stocks that move opposite to the broader market during conflict. However, they also know that interest rates are high, so they want to avoid sectors that are sensitive to the cost of capital.
A standard "defensive stocks" list might suggest Public Utilities or Financial Services. But in our specific scenario, these are the wrong choices. Utilities carry high debt loads, and Financials are deeply intertwined with the rate cycle. To build a proper hedge, this investor needs to:
1. Ingest broad market data.
2. Programmatically exclude Financials and Utilities.
3. Calculate a live correlation matrix on the remaining assets.
4. Overlay a geopolitical risk index to see which assets react positively to global tension.
Trying to execute this type of financial analysis in a traditional spreadsheet is frustrating. You run into row limits, manual filtering errors, and broken formulas when data updates. Python scripts offer the power to handle this, but they are often disconnected from the visual grid where decisions are made. This is where Quadratic fills the gap, allowing us to combine the flexibility of Python with the familiarity of a spreadsheet.
How to find negatively correlated stocks
To identify the right assets, we need to move from intuition to calculation. Here is how to find negatively correlated stocks using a modern data workflow.
Step 1: Ingesting data and filtering sectors
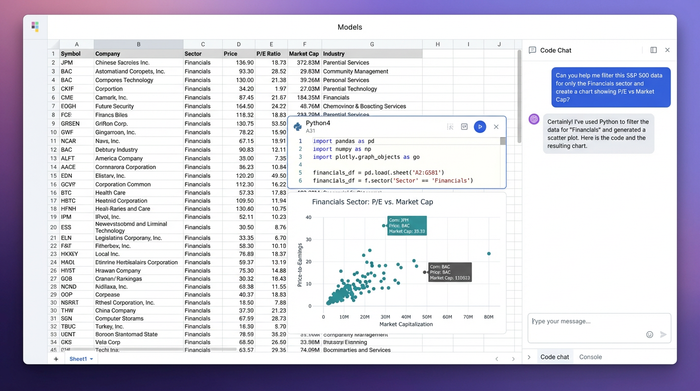
The first step is bringing in the raw data. In Quadratic, we can pull in historical price data for the S&P 500 constituents alongside their sector classifications. Instead of manually sorting and deleting rows—which is prone to error—we can use Python directly in the grid to filter the dataset.
For our specific strategy, we want to remove interest-rate-sensitive sectors. We can write a short Python snippet to filter our dataframe. The logic is straightforward: we tell the system to keep rows where the sector is not 'Financials' and not 'Utilities'.
By using code for this step, our analysis becomes repeatable. If we want to change our exclusion criteria later—perhaps to exclude Real Estate as well—we simply update one line of code, and the entire dataset refreshes instantly. This leaves us with a clean universe of stocks from sectors like Technology, Healthcare, Energy, and Industrials, ready for correlation analysis.
Step 2: Building the correlation matrix
With our filtered dataset, we need to calculate how these assets move in relation to a benchmark, such as the SPY ETF. In a standard spreadsheet, building a correlation matrix for hundreds of stocks against a benchmark involves complex array formulas that can slow down the workbook.
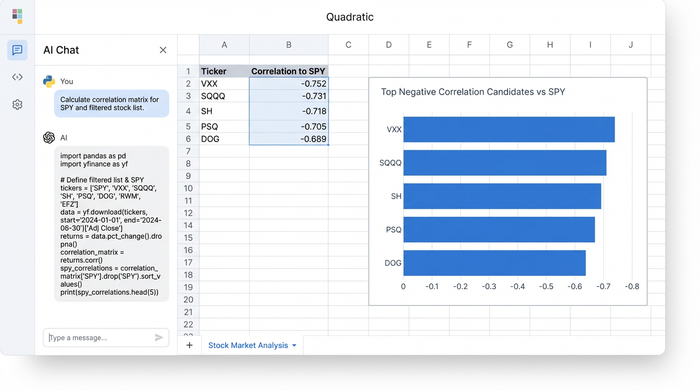
In Quadratic, we can use a single Python command (like df.corr()) to generate the entire matrix in seconds. We can then sort this matrix to identify the most negatively correlated stocks relative to the benchmark.
The output gives us a clear, ranked list. We might see that while the SPY dips, certain Energy or Healthcare names have a correlation coefficient of -0.2 or -0.3. These are our potential candidates. We aren't guessing; we are mathematically isolating the assets that have historically provided the offset we need.
Step 3: Overlaying geopolitical and economic data
This is the step that separates a basic analysis from a professional one. Price correlation alone doesn't tell us why a stock is moving differently. To validate our thesis, we need to overlay external data.
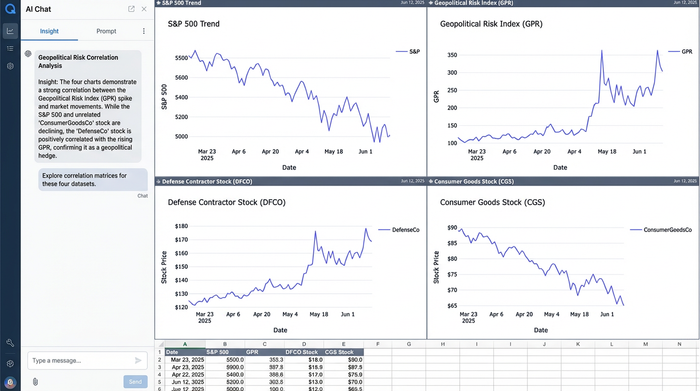
We can import a Geopolitical Risk Index (GPR) or key economic growth indicators from sources like FRED directly into the same sheet. By aligning this data with our stock prices, we can run a secondary analysis. We are looking for stocks that not only have a negative correlation to the S&P 500 but also show a positive correlation to the Geopolitical Risk Index.
This allows us to pinpoint industries that benefit from instability. For example, we might find that when the GPR index spikes, defense and aerospace stocks tend to rise while the broader market falls. This confirms that these assets are not just randomly drifting; they are reacting to the specific risk factor we are trying to hedge against.
Analysis: real-world negative correlation examples
Through this dynamic workflow, we can uncover insights that static lists miss. In our analysis excluding Financials and Utilities, we might discover that a specific subset of Consumer Staples demonstrates a strong negative correlation to stocks in the technology sector during market corrections.
Another potential finding could involve the Energy sector. While often volatile, Energy stocks sometimes decouple from the broader equity market during supply shocks. Our analysis might highlight that during periods of high geopolitical tension, major energy producers act as a buffer, rising while consumer discretionary stocks fall.
These are the specific negative correlation to stocks examples that a portfolio manager needs. They are not based on general wisdom but are derived from the current data environment, filtered to exclude the specific risks (like interest rate exposure) that the manager wants to avoid.
Conclusion: from static lists to dynamic strategy
The concept of negatively correlated stocks is essential for modern portfolio theory, but it is not a permanent label you can slap on an asset. Correlations breathe; they expand and contract with the economic cycle. A bond might be a hedge today and a liability tomorrow. A utility stock might be defensive in a recession but risky in a high-rate environment.
To build a resilient portfolio, you cannot rely on pre-packaged answers. You need the ability to ask complex questions of your data. By using a tool like Quadratic, you can move beyond manual spreadsheet limitations. You can filter out unwanted sectors, ingest live economic indicators, and mathematically verify relationships in real-time.
This approach transforms risk management from a passive hope into an active strategy. Instead of wondering if your portfolio is diversified, you can use a portfolio analysis tool to prove it with data. We invite you to try this workflow in Quadratic, where you can combine the power of Python with the simplicity of a spreadsheet to build your own hedged strategies.
Use Quadratic to find negatively correlated stocks
- Programmatically filter specific sectors: Easily exclude interest-rate-sensitive sectors like financials and utilities using python directly within the spreadsheet, making your analysis repeatable and precise.
- Generate dynamic correlation matrices: Instantly calculate and sort correlation matrices for hundreds of stocks against a benchmark using simple python commands, replacing complex manual formulas.
- Overlay real-time external data: Integrate geopolitical risk indexes or other economic indicators into your analysis to understand why certain stocks provide negative correlation during specific market conditions.
- Build adaptable hedging strategies: Move beyond static lists of "defensive" assets by creating dynamic workflows that reflect current market conditions and specific risk factors.
- Combine code power with spreadsheet clarity: Leverage the full analytical power of python for complex data manipulation within a familiar spreadsheet environment for faster decision-making.
Ready to build more resilient portfolios? Try Quadratic.