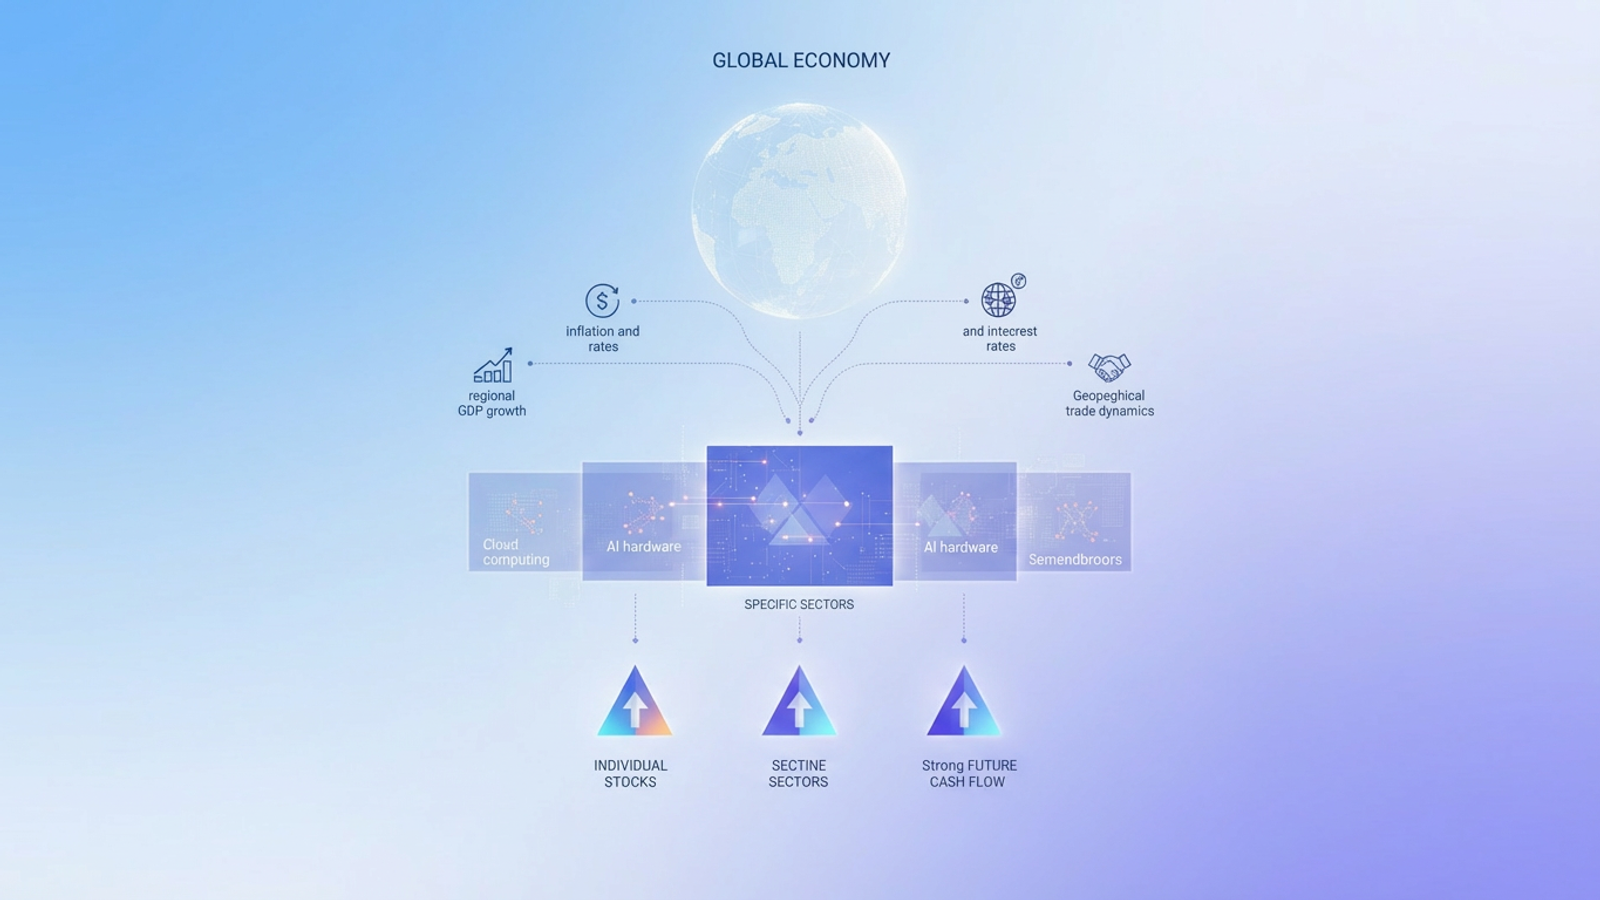
In today's volatile market, stock selection cannot happen in a vacuum. A company might have pristine balance sheets and innovative products, but if the broader economic tide is going out, even the best swimmer will struggle against the current. This is why sophisticated investors—from portfolio managers to MBA students—rely on a rigorous top-down approach. This rigorous top-down approach begins with the big picture and narrows its focus sequentially: global economy, specific sectors, and finally, individual stocks.
However, the primary pain point for most analysts is not a lack of knowledge, but a fractured workflow. Conducting a deep macroeconomic analysis usually involves checking data terminals in a browser, performing calculations in a spreadsheet, and writing the narrative in a separate word processor. By the time the report is finished, the data is often stale.
This article introduces a more dynamic method: building a living investment thesis. We will demonstrate how to perform a comprehensive analysis specifically for the technology sector using Quadratic, a tool that unifies data fetching, Python analysis, and narrative text on a single infinite canvas.
Why a thorough environmental analysis includes a macroeconomic analysis
Before an analyst can confidently recommend a stock, they must understand the environment in which that company operates. A thorough environmental analysis includes a macroeconomic analysis because external factors often outweigh internal performance in the short to medium term.
For a technology-focused portfolio, requiring thorough portfolio analysis, several key macro drivers are non-negotiable:
- Regional GDP growth: This identifies which geographical markets are expanding. For tech hardware, this signals where demand for devices might spike.
- Inflation and interest rates: These are the gravity of valuation. High interest rates increase the discount rate applied to future cash flows, which disproportionately hurts high-growth tech stocks.
- Geopolitical trade dynamics: In a globalized supply chain, trade barriers or tariffs can disrupt semiconductor availability overnight.
Knowing these indicators is step one. Aggregating them into a dynamic model that updates automatically is step two. Instead of treating these data points as static numbers in a quarterly report, modern analysts use integrated tools to monitor these shifts in real time, leveraging advanced financial data analytics.
The workflow: building a top-down model in Quadratic
The traditional spreadsheet is often too rigid for complex modeling, while Jupyter notebooks can be too abstract for financial storytelling. Quadratic bridges this gap with an infinite canvas where code, data grids, and documentation live side-by-side. This allows analysts to build a transparent, repeatable top-down model, akin to robust FP&A modeling.
Step 1: The macro view (global indicators)
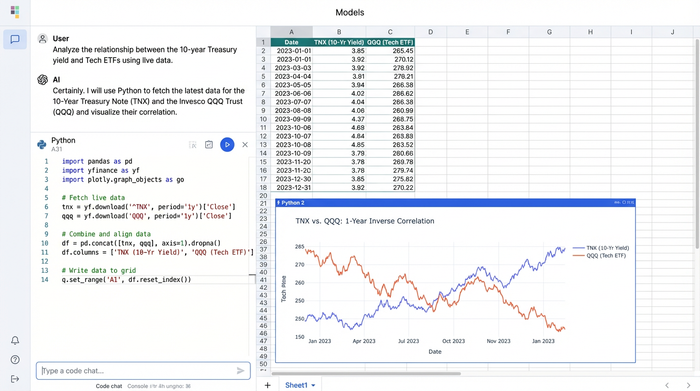
The first step in a top-down strategy is establishing the global context. In a standard workflow, an analyst might manually download CSV files from the Federal Reserve Economic Data (FRED) or the World Bank. In Quadratic, we replace this manual labor with Python-based automation.
Using the built-in Python editor, you can fetch live data directly from financial APIs. For a robust macroeconomic environment analysis, you might write a script to pull the 10-year Treasury yield and perform a stock index comparison with the performance of a technology ETF, such as XLK. This allows you to visually inspect the inverse correlation between rising rates and tech valuations.
By scripting this process, you avoid the need for expensive, black-box algorithm research macroeconomic analysis services. Instead, you build your own proprietary view of the market. If you need to visualize regional GDP growth to decide between allocating capital to US-based software firms or Asian hardware manufacturers, you simply adjust the parameters in your Python code, and the data grid updates instantly.
Step 2: The sector view (technology trends)
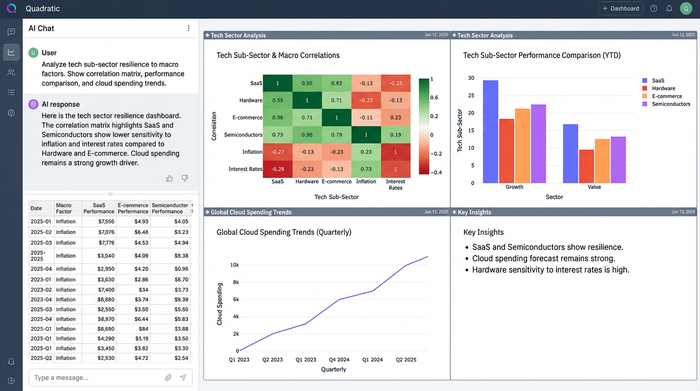
Once the global stage is set, the analysis moves to the sector level. The goal here is to determine which parts of the technology sector are resilient to the macro headwinds identified in step one.
For example, if your macro view suggests persistent inflation, you need to determine which tech sub-sectors have pricing power. Software-as-a-Service (SaaS) companies often can raise prices to match inflation, whereas hardware companies might suffer from rising component costs.
In Quadratic, you can filter your macro data down to sector-specific metrics. You might use Python libraries like Pandas and Seaborn to generate a correlation matrix. This visualization could reveal that semiconductor stocks are highly sensitive to geopolitical news, while enterprise cloud spending remains stable regardless of interest rate hikes. This visual confirmation helps refine the investment thesis before you ever look at a specific ticker symbol.
Step 3: The micro view (stock selection)
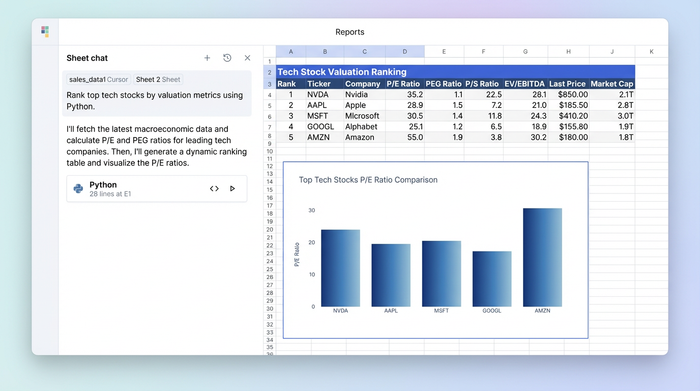
The final stage of the top-down approach is picking the winners, a process often guided by comprehensive asset research. Based on the macro and sector filters, you can now identify the best companies for macroeconomic trend analysis in financial services portfolios. These are typically firms with strong cash flows that can self-fund growth even when capital markets are tight.
On the Quadratic canvas, this step blends the power of Python with the familiarity of spreadsheets. You can pull financial statements for companies like Apple, Nvidia, or Microsoft using Python, and then use standard spreadsheet formulas to calculate financial valuation metrics like P/E ratios or PEG ratios.
The outcome is a dynamic ranking table. Unlike a static Excel sheet, this table is linked to the macro data from step one. If the 10-year Treasury yield inputs change, your discount rate formulas update, potentially reshuffling your ranking of the most attractive stocks after a thorough stock market analysis.
Best tools for macroeconomic analysis: why integration matters
The market is flooded with platforms claiming to be the best tools for macroeconomic analysis, but most suffer from the same flaw: disintegration. The "old way" involves a static Excel model pasted into a PowerPoint slide. The moment the market moves, the slide is obsolete.
Integration matters because it keeps the narrative honest. In Quadratic, your written investment thesis—the text explaining why you are bullish on AI hardware, potentially leveraging AI tools for finance—lives directly next to the data and charts supporting that claim. If the underlying data changes, the charts update immediately, prompting you to re-evaluate your written thesis.
This capability transforms the analysis from a snapshot in time into a living document. It allows financial professionals to move beyond basic arithmetic and incorporate complex data fetching and statistical financial time series analysis without leaving the spreadsheet interface.
Advanced concepts & methodology (FAQ)
To deepen the rigor of a top-down analysis, analysts often incorporate specific economic methodologies.
How does supply and demand factor into this model?
While often taught as a basic concept, AP macroeconomics supply and demand analysis is critical for forecasting hardware pricing, which is key for product profitability analysis. For instance, an analyst might look at aggregate demand shifts in consumer electronics to predict revenue shortfalls for chip manufacturers.
What is marginal analysis in this context?
Sophisticated investors use marginal analysis macroeconomics to look at rates of change rather than absolute numbers. It is less important that inflation is at 3% and more important whether it is accelerating or decelerating at the margin. Python scripts in Quadratic can easily calculate these second-derivative changes to flag trend reversals early.
Where can I find reliable data?
Beyond standard government sources, institutions like the Centre for Applied Macroeconomic Analysis often publish working papers and datasets. These specialized datasets can be imported into Quadratic to give your model an edge over consensus estimates.
Conclusion
A successful top-down investment strategy requires more than just access to data; it requires the ability to synthesize global trends, sector dynamics, and company financials into a coherent narrative. By moving away from disjointed tools and embracing a unified workspace, analysts can build models that are as dynamic as the markets they track.
Instead of spending hours copying and pasting stale data, try Quadratic. It offers the integrated environment necessary to turn raw macroeconomic analysis into a compelling, data-driven investment thesis.
Use Quadratic to do macroeconomic analysis
- Unify your entire workflow: Fetch live macroeconomic data, perform Python analysis, and write your investment narrative on a single, infinite canvas, eliminating fragmented tools.
- Build dynamic, real-time models: Create living investment theses where global indicators like GDP growth, inflation, and interest rates update automatically, ensuring your analysis is always current.
- Automate complex data fetching: Use native Python to pull live data from financial APIs directly into your spreadsheet, replacing manual CSV downloads and proprietary black-box services.
- Seamlessly integrate macro and micro views: Filter global economic trends down to sector-specific insights and individual stock valuations, with all data and calculations connected and updating instantly.
- Visualize economic impacts with clarity: Generate correlation matrices and charts using Python libraries (Pandas, Seaborn) to clearly understand how macroeconomic shifts affect tech sector performance.
- Maintain a transparent and auditable thesis: Keep your written analysis directly linked to live data and charts, allowing for immediate re-evaluation of your conclusions as market conditions change.
Ready to build your next investment thesis? Try Quadratic