
Table of contents
- The "freshness" problem: why standard Excel exports fall short
- Building a self-updating command center
- Moving beyond "viewing": logic-based alerts and rolling comparisons
- 3 strategic advantages for the performance marketer
- Conclusion: the future of spreadsheet analytics
- Use Quadratic to monitor real-time Google Analytics data for rapid response
Google Analytics 4 (GA4) is an incredibly powerful tool for analyzing long-term trends and user behavior, but it suffers from a critical flaw for performance marketers: latency. Standard reporting can take 24 to 48 hours to process and finalize data, a common issue known as GA4 data processing latency. If you are running a flash sale, a high-stakes email blast, or a significant ad spend campaign, waiting until tomorrow to see how you performed today is simply too late.
This latency drives thousands of marketers to search for real-time Google Analytics data in Microsoft Excel. The goal is simple: you want the flexibility and familiarity of a spreadsheet, but you need the data to be alive. While Microsoft Excel is the industry standard for analysis, getting a live, sub-second data pipe into it usually requires cumbersome workarounds, expensive third-party plugins, or manual CSV exports that are obsolete the moment they hit your customized downloads folder.
There is a better way to achieve this workflow. By using a "live spreadsheet" environment like Quadratic, you can bypass the limitations of static exports. You can build a self-updating command center that pulls real-time GA4 data directly into the grid, allowing you to monitor live campaign performance with the same logic and formulas you already know.
The "freshness" problem: why standard Excel exports fall short
When marketers attempt to build real-time monitors in traditional spreadsheets, they typically run into three distinct barriers.
First is the manual export loop. This is the most common workflow: a marketer opens GA4, navigates to a report, exports a CSV, and pastes it into Excel to update a pivot table. This process is static. It offers a snapshot of the past, not a view of the present. By the time you have formatted the data, the traffic spike you were looking for might have already dissipated.
Second is the reliance on native connectors or plugins. While there are plugins that attempt to pipe real-time Google Analytics data in Microsoft Excel, they often come with significant overhead. Many require paid subscriptions, impose strict row limits, or fail to refresh frequently enough to be considered truly "real-time."
Finally, there is the enterprise data stack approach, often involving BigQuery. While effective, sending GA4 data to BigQuery and then connecting that to a spreadsheet is a heavy engineering lift. It requires SQL knowledge and data warehousing infrastructure that most growth managers do not want to manage just to monitor a campaign launch.
Most marketers simply want a spreadsheet that updates itself without requiring them to become data engineers.
Building a self-updating command center
In Quadratic, the workflow changes from "export and paste" to "connect and monitor." Because Quadratic integrates directly with the GA4 API at the cell level, you can pull live data without leaving the grid.
Step 1: The direct connection
Instead of downloading a file, you connect your Google Analytics account directly to the spreadsheet. This establishes a secure link to your property. You aren't importing a dataset; you are creating a live query.
Step 2: Pulling live metrics
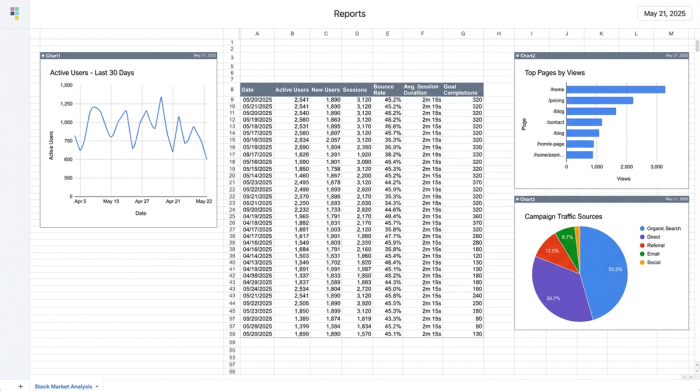
For a performance marketer, not all data needs to be real-time—just the metrics that drive immediate decisions. In a typical real-time monitoring use case, a user will configure the sheet to pull the following specific metrics:
- Active Users: This serves as the heartbeat of the site. A sudden drop here indicates a technical failure, while a spike indicates a viral moment.
- Top Pages: By querying the
unifiedScreenNameor page path in real-time, you can identify exactly which landing pages are trending right now. - Campaign Spikes: By filtering for
campaignNameorsourceMedium, you can isolate traffic sources to see the immediate impact of an email blast or influencer post.
Because this data lives in the grid, it isn't a static image. It is a set of values that can be referenced by formulas, charted, or manipulated just like any other spreadsheet data.
Moving beyond "viewing": logic-based alerts and rolling comparisons
The primary advantage of bringing real-time GA4 data in spreadsheets is not just seeing the numbers, but reacting to them. Standard dashboards are passive; they require you to look at them to find insights. A programmable spreadsheet allows you to build logic that flags issues for you.
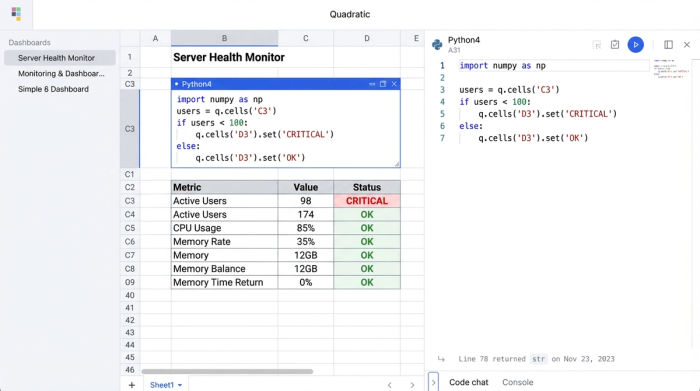
The power of Python in cells
Quadratic allows you to write Python directly in the cells. This enables you to clean and manipulate the raw JSON data coming from GA4 instantly. You don't need to be a developer to do this; simple scripts can parse the API response and lay it out into columns and rows automatically.
Setting thresholds and alerts
Once the live data is in the cells, you can use conditional formatting or Python logic to create a visual alert system.
For example, a growth manager can set a threshold for Active Users. If the number drops by more than 15% compared to the rolling average of the last hour, the cell background turns red. If a specific landing page's conversion rate dips below a target during a high-traffic window, the sheet can flag it for immediate review. This turns the spreadsheet from a reporting tool into a monitoring tool, akin to an AI dashboard GA4.
Rolling comparisons
Native GA4 real-time reports often show a stream of users but lack context. Is 500 users good or bad? By using Python in the spreadsheet, you can calculate rolling averages (e.g., "Last 30 minutes vs. Previous 30 minutes"). This contextualizes the real-time spikes, helping you distinguish between normal volatility and a significant event.
Why logic-based monitoring beats "dashboards"
Standard visualization tools like Looker Studio are excellent for presentation, but they often lack the logic capabilities of a spreadsheet, making it difficult to build truly custom dashboards. They show you what is happening, but they rarely tell you if it should be happening. A logic-based workflow allows for conditional reporting—showing you data only when it matters, such as when an anomaly is detected.
3 strategic advantages for the performance marketer
Shifting to a live spreadsheet environment offers three distinct business advantages for teams managing high-velocity campaigns.
1. Speed to Action: When you eliminate the latency of standard reporting, you can react to broken funnels or viral moments in minutes, not days. This agility is often the difference between a wasted budget and a record-breaking campaign, with real-time data freshness enabling 20% better campaign response rates and 15% higher close rates within six months.
2. Flexible Granularity: Unlike rigid dashboard widgets, data in a spreadsheet grid is infinitely malleable. You can pivot, sort, filter, and combine the real-time data with other datasets (like ad spend CSVs) instantly.
3. Simplified Stack: This workflow removes the need for SQL queries, data warehouses, or paid third-party connector plugins. It democratizes access to real-time data, allowing marketers to build their own tools without waiting on the data engineering team.
Conclusion: the future of spreadsheet analytics
The search for real-time Google Analytics data in Microsoft Excel stems from a desire to combine the flexibility of a Google Analytics spreadsheet with the urgency of live data. While traditional methods involve clunky workarounds, modern platforms like Quadratic offer a streamlined solution.
By treating the spreadsheet as a live application rather than a static document, performance marketers can build Excel-style analytics workflows that are responsive and intelligent. You get the familiarity of the grid with the power of a data app.
If you are tired of refreshing yesterday's reports, try the GA4 template in Quadratic. You can connect your data and set up a real-time monitor in minutes, giving you the visibility you need to respond when it counts.
Use Quadratic to monitor real-time Google Analytics data for rapid response
- Connect directly to the GA4 API, pulling live metrics like active users, top pages, and campaign performance right into your spreadsheet.
- Bypass GA4's standard 24-48 hour data processing latency for instant insights into high-stakes campaigns.
- Build self-updating command centers that refresh automatically, eliminating manual CSV exports and outdated data.
- Use Python in cells to clean raw GA4 data, set logic-based alerts, and create rolling comparisons (e.g., this hour vs. last hour).
- Transform your monitoring from passive dashboards to proactive systems that flag issues like conversion dips or traffic drops in real time.
- Simplify your data stack by removing the need for BigQuery, SQL, or expensive third-party plugins for live GA4 data.
Ready to see your GA4 data live? Try Quadratic.