
Table of contents
Finding the right suppliers is often considered the most critical part of the procurement process, but for modern inventory managers, finding the source is only half the battle; the real challenge lies in robust inventory analytics. The real challenge in retail product sourcing lies in the analysis: comparing apples to apples when every supplier formats their data differently. You might have five potential vendors for a hardware inventory list, but if their price sheets are a mix of PDFs, inconsistent CSVs, and scraped web data, making a clear financial decision becomes a nightmare.
For many professionals, the workflow hits a wall when they try to import this messy data into a standard spreadsheet. Cells containing price ranges, missing values, or mixed currencies break traditional formulas, forcing you to spend hours manually cleaning rows instead of analyzing margins. This is where the concept of a "computational spreadsheet" changes the game. By using a tool like Quadratic, which integrates Python directly into the grid, you can bridge the gap between technical data scraping and business decision-making, turning raw, chaotic data into a clean, decision-ready comparison table in minutes.
The data challenges of product sourcing for retail chains
When you buy products from primary sources and sell to retailers, margins are often incredibly tight. In categories like stationery or hardware, a difference of a few cents per unit across thousands of items can significantly impact the bottom line. However, accurate comparison is difficult because the data integrity in product sourcing for retail chains is rarely perfect, and poor data quality can cost organizations millions annually.
The reality of sourcing is that data is messy. You are likely dealing with inconsistent formats where one supplier lists a pack of pens as a flat "$5.00" while another lists a range of "$4.50-$5.50" depending on volume. Furthermore, scraped web data often comes with missing values or partial pricing information. In a multi-shop environment, where you need to manage inventory across different locations, trying to reconcile these discrepancies across twenty different static Excel files is a recipe for error. To make confident purchasing decisions, you need a unified view that handles these irregularities automatically.
The "middle layer": bridging the gap between scraping and strategy
Most guides on procurement focus on two ends of the spectrum: how to scrape data from the web or how to negotiate the final contract. They rarely address the "middle layer"—the painful process of taking raw JSON or CSV data from a scraper and turning it into a clean, analyzable table.
This is the workflow where most analysts get stuck. You have the raw data, but it is not ready for a pivot table or a budget calculation. Traditional spreadsheets require complex, fragile formulas to parse text strings, and they often crash when loaded with large datasets. Quadratic offers a different approach by allowing you to use Python directly within the spreadsheet cells. This enables you to clean, parse, and normalize data programmatically without needing a data science team or leaving the familiar spreadsheet interface.
Step 1: Ingesting and normalizing scraped data
The first step in any retail product sourcing workflow is getting all your supplier data into one place. In a typical scenario, you might be importing large lists of hardware and stationery items from multiple sources. Some of this might be standard CSV files, but modern scraping tools often output JSON files, which can be difficult to structure in legacy spreadsheets.
In Quadratic, you can pull data directly from APIs or import raw files without worrying about row limits or formatting errors. Because the environment supports Python, you can write a simple script to flatten nested JSON data into a readable table instantly. This ensures that your supplier data—regardless of its original format—lands in your sheet as structured rows and columns, ready for analysis, a process often referred to as data normalization.
Step 2: Solving the "price range" problem (parsing logic)
One of the most specific frustrations in sourcing analysis is the "price range" problem. When a supplier's data is scraped from a website, the price column often contains text strings like "$10-$12" rather than a single numerical value. Standard spreadsheet formulas struggle to interpret this; they see text, not numbers, which breaks any summation or average calculation you try to run.
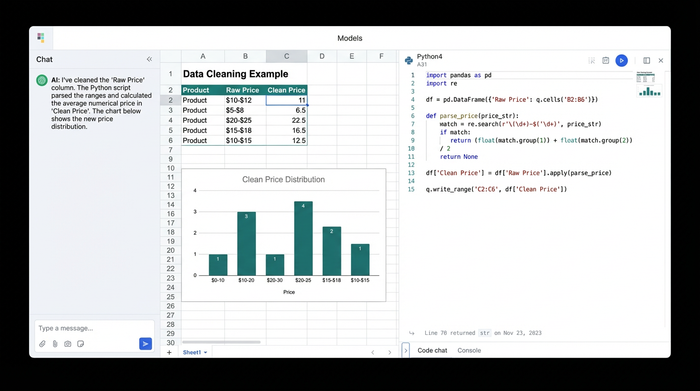
Quadratic solves this by allowing you to apply Python logic to the column. Instead of writing a convoluted nested formula, you can write a short Python script to perform data parsing on the string. The logic is straightforward: the script checks the cell to see if a hyphen exists. If it does, it splits the string, identifies the low and high prices, and calculates the average (or the max, depending on your risk preference). If no hyphen exists, it simply treats the number as a float. This instantly converts a column of mixed text and numbers into a clean column of calculable integers or floats, allowing you to proceed with your budget planning.
Step 3: Handling missing values and partial data
Incomplete data is inevitable. Some suppliers may not list prices for every SKU, or the scraper might have missed a field. In a standard spreadsheet, these null values can result in errors that propagate through your entire workbook, or worse, they might be treated as zeros, artificially lowering your estimated costs.
Using Python in Quadratic allows you to handle these missing values intelligently. You can programmatically flag items that have incomplete data so they don't skew your analysis. Alternatively, you can backfill missing prices with the average market rate calculated from other suppliers in your list. This ensures that your total budget calculation remains realistic and robust, rather than breaking every time a cell is empty.
Analyzing the results: identifying the cheapest source
Once the data is ingested, parsed, and cleaned, the focus shifts to decision-making. With a normalized dataset, you can build the final output tables that drive your purchasing strategy.
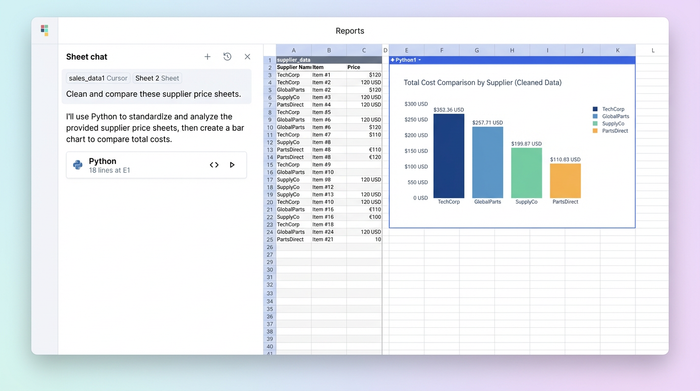
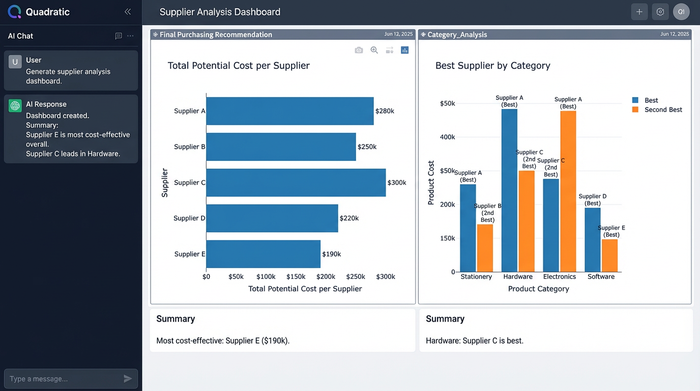
The first deliverable is usually a "Total Estimated Cost" summary. This is a summation of the cheapest available options for your full inventory list, giving you a baseline budget. The second, and perhaps more actionable deliverable, is a supplier breakdown. You can generate a table that groups items by category—showing, for example, that Supplier A is the most cost-effective source for stationery, while Supplier B offers better rates for hardware. This level of granularity allows you to split your purchase orders strategically rather than relying on a single vendor for everything.
Moving from static reports to dynamic updates
The final advantage of this approach is agility. In retail product sourcing, prices fluctuate weekly, if not daily. A static report built in a standard spreadsheet is obsolete the moment you save the file. If you want to update the analysis next week, you typically have to repeat the entire manual cleaning process.
Quadratic changes this dynamic. Because the cleaning and parsing logic is scripted in Python within the sheet, updating your analysis is as simple as refreshing the data source. When new scraped data is pulled in, the Python scripts automatically re-run—parsing the new price ranges, handling the new null values, and recalculating the cheapest sources. This transforms your work from a one-time static report into a dynamic dashboard that provides an always-up-to-date view of the market.
Conclusion
Modern sourcing is no longer just about negotiation skills; it is about data agility. The ability to quickly synthesize messy, disparate data sources into a coherent strategy is what separates successful procurement teams from those bogged down in administrative work. By using a tool that handles the "messy middle" of data analysis, procurement professionals can stop fixing broken formulas and start focusing on the strategic decisions that improve margins. If you are ready to move beyond static spreadsheets and automate your price comparison workflows, try Quadratic for your next multi-supplier analysis.
Use Quadratic to Streamline Retail Product Sourcing
- Consolidate messy supplier data: Ingest diverse formats like CSVs, JSON, and API outputs, then automatically normalize them into a single, clean table for analysis.
- Parse complex price ranges: Apply Python logic directly in cells to convert text-based price ranges (e.g., "$10-$12") into calculable numbers, enabling accurate cost comparisons.
- Handle incomplete data intelligently: Programmatically flag missing values or backfill them with market averages, ensuring robust and realistic budget calculations.
- Identify optimal suppliers instantly: Analyze normalized data to quickly determine the cheapest sources for specific products or categories, optimizing your purchasing strategy.
- Create dynamic, self-updating reports: Automate data cleaning and analysis, transforming static reports into live dashboards that refresh with new supplier data, always reflecting current market prices.
Ready to streamline your product sourcing analysis and make smarter purchasing decisions? Try Quadratic.