
Signing a Service Level Agreement (SLA) is the easy part of a contract. Proving that you are adhering to it—month after month, across thousands of support tickets and incidents—is a different challenge entirely. For service operations managers and data analysts, the reality of SLA compliance is often a monthly struggle involving messy CSV exports, slow spreadsheets, and complex logic calculations that standard tools simply aren't designed to handle.
So, what is SLA compliance? At its core, it is the practice of monitoring, analyzing, and reporting on agreed-upon service standards to ensure contractual obligations are met, guided by established SLA best practices. While the concept is straightforward, the execution is data-intensive. As an organization grows, the volume of transactional and issue-tracking data can quickly overwhelm traditional spreadsheets like Excel or Google Sheets. These tools often freeze or crash when processing tens of thousands of rows, turning what should be a routine report into a manual nightmare.
Quadratic bridges this gap. By combining the familiarity of a spreadsheet with the processing power of Python, Quadratic allows analysts to ingest large datasets, clean messy ticket metadata, and generate precise compliance reports without the performance lag of standard tools.
Understanding SLA compliance in service operations
To effectively report on performance, it is helpful to start with a clear SLA compliance definition. It is the metric that tracks the percentage of time a service provider meets the specific performance targets outlined in their contract, such as uptime, response time, or resolution time, with resources often defining a good SLA compliance rate as exceeding 95%.
There is a distinct difference between general performance metrics and compliance SLA requirements. A general metric might look at the "average time to resolve a ticket," which can be skewed by a few outliers. Such metrics are often part of a broader IT service delivery framework designed to manage and improve IT services. Compliance, however, is binary for every single transaction: did this specific ticket meet the 4-hour resolution target? Yes or no? Aggregating these binary results across thousands of incidents provides the true compliance percentage.
This becomes even more complex when ensuring SLA compliance in multi-location businesses. Data often arrives from fragmented sources—different regional ticketing systems or time zones—requiring a unified view to determine if global standards are being met. Without a robust way to centralize and normalize this data, accurate reporting is nearly impossible.
The challenge: Why standard spreadsheets fail at scale
Most service operations professionals rely on spreadsheets because they are flexible and accessible. However, standard spreadsheets suffer from a significant "volume gap" when used for rigorous SLA analysis.
The primary issue is data volume. Modern service desks generate massive amounts of transactional and issue-tracking data, contributing to the broader challenges of big data. A single month of call log data for a mid-sized enterprise can easily exceed tens of thousands of rows. When you attempt to load this data into a standard spreadsheet, the application often slows to a crawl, calculation chains break, and the risk of the software crashing increases significantly.
The second challenge is logic complexity. Calculating simple date differences is easy, but calculating "Business Hours" versus "Calendar Hours" is notoriously difficult in standard grid formulas. If an SLA dictates a 4-hour response time during business hours only, a ticket coming in at 4:55 PM on a Friday shouldn't breach until Monday morning. Building formulas to account for weekends, holidays, and custom operational hours across thousands of rows, and the general complexity of calculating business hours between two dates, is error-prone and computationally heavy for traditional tools.
Finally, there is the pain of data integration. Analysts often waste hours manually copying and pasting exports from reporting systems into static sheets, a process that is not only tedious but also introduces human error.
Workflow: Analyzing large datasets for SLA reporting
Quadratic solves these challenges by allowing users to manage large, multi-sheet tabular datasets within an infinite canvas that supports Python natively. Here is how a service operations professional can streamline their reporting workflow.
Step 1: Ingesting ticket metadata & transactional data
The workflow begins by bringing raw data into Quadratic. Because Quadratic is built to handle data more like a database than a standard sheet, leveraging the power of Python and SQL, you can pull in heavy CSVs containing incidents, service requests, and ticket metadata without worrying about performance lag.
Instead of splitting data across multiple files to avoid row limits, you can keep your entire dataset in one place. This allows you to view the raw transactional data side-by-side with your analysis, maintaining a clear audit trail from the source export to the final KPI report.
Step 2: Cleaning data with Python
Once the data is in the grid, the real work begins. Standard spreadsheets require complex, fragile formulas to clean text or reformat dates. In Quadratic, you can use Python for data analysis—specifically the Pandas library—directly in the spreadsheet cells to clean the data programmatically.
For example, you can write a short script to parse varying timestamp formats, remove duplicate entries caused by system glitches, or categorize tickets based on specific metadata tags. This approach is not only faster but also repeatable. When next month’s data arrives, the cleaning logic is already in place and ready to run.
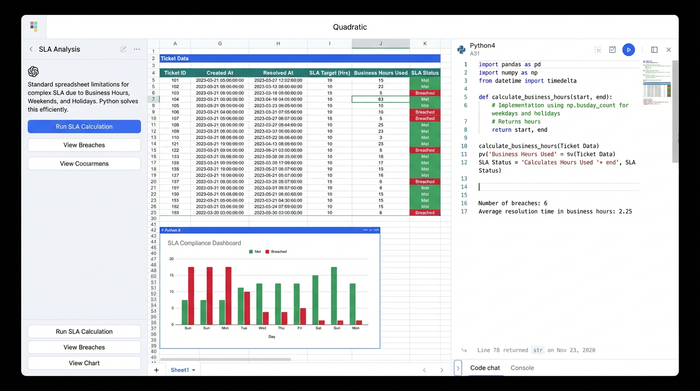
Step 3: Calculating breach reports
Accurately identifying SLA compliance breaches requires precise logic. Using Python, you can script the exact rules of your performance contract.
You can write a function that compares the "Time Created" and "Time Resolved" columns while filtering out non-business hours and holidays. The script can then flag every specific ticket that exceeded the target resolution time. This programmatic approach eliminates the risk of formula errors and ensures that your breach report is based on the exact logic defined in your contract, rather than an approximation.
Step 4: Visualizing performance KPIs
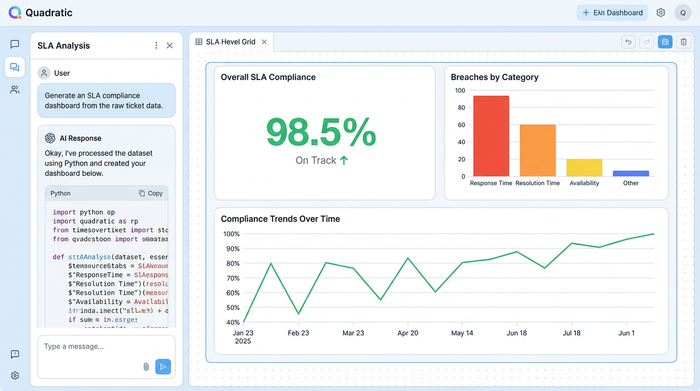
Data is only useful if it communicates a clear story to stakeholders. The final step is integrating data for KPI visualization.
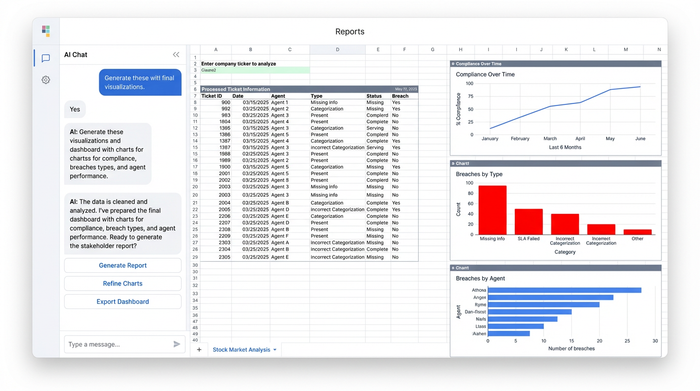
In the same workspace where you cleaned and analyzed the data, you can create a dashboard that summarizes the findings. You might display a line chart showing compliance trends over the last six months, a bar chart breaking down breaches by ticket severity, or a summary table highlighting the top operational challenges. By keeping the visualization next to the code and data, you can answer questions during stakeholder meetings instantly by tweaking the underlying parameters.
Specialized contexts for SLA analysis
The need for rigorous data analysis extends beyond general IT help desks into specialized verticals.
In the realm of connectivity, network performance management SLA compliance relies on analyzing massive logs of packet loss, latency, and jitter. Robust telecom data analysis tools are essential for this. These datasets are often too large for Excel, making a Python-enabled spreadsheet an ideal environment for spotting anomalies.
Similarly, when evaluating vendors, selecting the best application delivery service for SLA compliance requires you to validate their claims. By importing their performance logs into Quadratic, you can independently verify if they are meeting their uptime guarantees.
This workflow is also critical for marketplace SLA compliance, where platform operators must track the performance of thousands of third-party vendors, often requiring a logistics KPI dashboard. Analyzing transaction times and dispute resolution speeds across a marketplace requires a tool that can handle high-volume data without flinching.
Conclusion: Moving from data to decision making
True SLA compliance is not just about avoiding penalties or pointing fingers; it is about having the visibility required to improve operations. When you trust your data, you can identify training gaps, resource shortages, or systemic technical issues that are causing breaches.
Moving your heavy-duty service operations reporting out of standard spreadsheets and into a tool built for scale allows you to focus on these insights rather than fighting with the software. Quadratic offers the power of Python and the simplicity of a spreadsheet, giving you the control to turn raw ticket data into decisive action.
Use Quadratic to do SLA compliance
- Ingest and manage massive datasets without slowdowns or crashes, bringing thousands of support tickets and incident logs into a single workspace.
- Automate data cleaning with Python directly in the grid to parse messy timestamps, remove duplicates, and categorize ticket metadata quickly and repeatably.
- Precisely calculate SLA breaches by scripting complex business hour logic, holidays, and multi-location rules to accurately flag compliance for every single transaction.
- Generate auditable compliance reports by keeping raw data, cleaning scripts, and final reports together in one workspace for full transparency and easy verification.
- Visualize performance KPIs instantly to track compliance trends and identify operational issues directly from your analysis, answering stakeholder questions on the fly.
Ready to simplify your SLA compliance reporting? Try Quadratic.