
Launching a marketplace or SaaS platform requires more than just clean code and a sleek user interface; it requires a robust financial feasibility study. When building a financial model for a sports facility booking system, entrepreneurs often hit a wall with traditional spreadsheet tools. The standard approach involves a "black box" model where inputs are hidden in one tab, complex logic is buried in another, and outputs appear in a third. This fragmentation makes it difficult to see how a small change in facility registration rates impacts cash flow six months down the line.
By utilizing Quadratic’s infinite canvas, you can build a startup financial model in a single, unified workspace. By utilizing Quadratic’s infinite canvas, you can model a startup in a single, unified workspace. This article walks through a real-world use case of a business professional modeling an urban market startup, moving from vague assumptions to a concrete, localized financial plan.
The scope: defining the business model
Before you can calculate ROI, you must clearly define your inputs. In our specific use case, the user was building a model for an urban market startup designed to connect athletes with local venues. The goal was to validate the business case before writing a single line of application code.
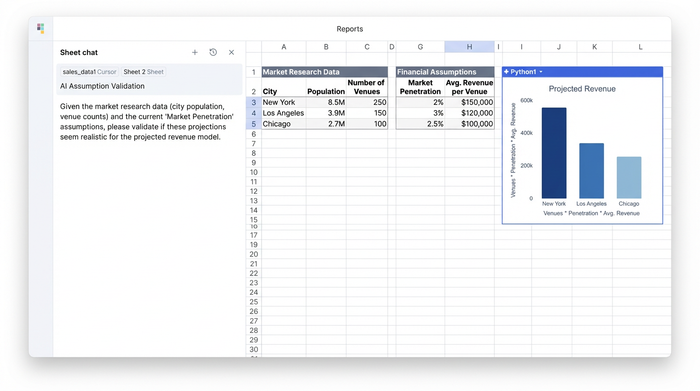
In a traditional spreadsheet, market research data is often kept in a separate document from the financial model. On an infinite canvas, you can place your market data directly next to your financial assumptions. For this sports facility booking system, the user visualized the total addressable market—specifically urban athletes and available venue hours—alongside their revenue streams.
This visual proximity allows you to sanity-check your inputs immediately. If your model assumes a 20% market penetration in year one, having the raw population data visible right next to that assumption highlights whether your projection is realistic or optimistic.
Structuring revenue logic for a sports facility booking system
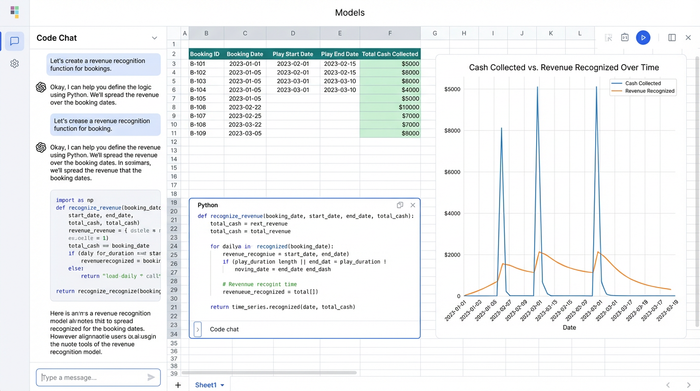
Revenue recognition is one of the most complex aspects of modeling a booking platform. Unlike a simple retail transaction, a booking system often collects money at the time of reservation but recognizes the revenue only when the game is actually played. This creates a gap between cash flow and recognized revenue.
Standard spreadsheets typically handle this with brittle, nested IF statements that stretch across the formula bar. These formulas are difficult to read and even harder to debug if the model breaks.
In this use case, the user leveraged Quadratic’s integration of Python to handle the revenue recognition logic. Instead of an unreadable formula, the user wrote a clean Python script directly in the sheet to calculate when revenue should be recognized based on booking dates versus play dates. This approach transforms the logic into readable code. Anyone reviewing the model can look at the cell and understand exactly how the sports facilities booking system accounts for income, ensuring the financial model is auditable and transparent.
Modeling operational costs and localization
A major challenge for international startups is adapting generic financial templates to local realities. Most downloadable templates are rigid and US-centric, making it difficult to adjust for different currencies or text formatting.
The user in our case study required specific language localization, including Right-to-Left (RTL) text support, and local currency formatting to present the feasibility study to local investors. Quadratic’s flexible grid allowed for these adjustments without breaking the underlying logic.
Once the localization was set, the model focused on the Monthly Operational Budgets (OPEX). This section detailed the costs required to keep the platform running, including:
- Personnel: Salaries for sales teams and developers.
- Server and Hosting: The cost of maintaining the database and application uptime.
- Marketing: The Customer Acquisition Cost (CAC) for both facilities and athletes.
This is also where you model the viability of different tiers. If you are planning to launch a free sports facilities booking system as a strategy to gain market share, you need to model the cost of supporting those free users. By isolating the server and support costs per user, the model can show exactly how many paid subscriptions are required to subsidize the free tier, turning a marketing strategy into a calculated financial decision.
Visualizing the flow: from registration to revenue
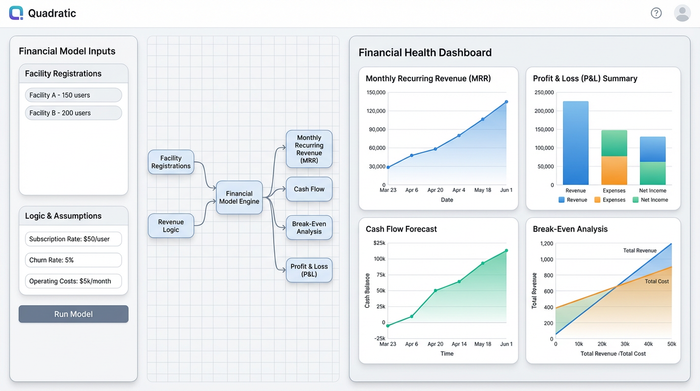
The most distinct advantage of using an infinite canvas for this feasibility study was the elimination of the "black box" effect. The user structured the model to flow logically from left to right, mirroring the actual business operations.
1. Left (Inputs): Facility registration data and market assumptions were placed on the far left. This included the number of venues onboarding per month and their available inventory.
2. Center (Logic): The calculations, powered by Python and formulas, sat in the middle. The final revenue tracking, Profit & Loss (P&L), and cash flow statements were displayed on the right.
3. Right (Outputs): The final revenue tracking, Profit & Loss (P&L), and cash flow statements were displayed on the right.
This layout allows stakeholders to see the cause and effect of business decisions instantly. You can trace a single facility registration on the left all the way through to its impact on the bottom line on the right, without ever clicking a tab or losing context.
Analyzing profitability and break-even scenarios
The ultimate goal of the feasibility study is to answer the question: When does the business become profitable? The user utilized the model to run various profit and break-even scenarios.
By connecting to a database via SQL, the user can pull in actual booking numbers to compare against the financial forecasts in real-time. By connecting to a database via SQL, the user can pull in actual booking numbers to compare against the forecasts in real-time.
For the feasibility stage, the focus remained on key metrics:
- Break-even point: The exact number of bookings required to cover monthly OPEX.
- Runway: How long the initial investment will last based on the burn rate.
Whether you are building a premium enterprise platform or a free sports facilities booking system, knowing your break-even point is non-negotiable. The model highlighted exactly how sensitive the business was to changes in the average commission rate, allowing the founders to adjust their pricing strategy before launch.
Conclusion: moving beyond the grid
A modern sports facility booking system requires a modern approach to financial modeling. Relying on disconnected spreadsheet tabs and brittle formulas can obscure the realities of your business. By using a tool that supports complex logic through Python, handles international localization, and visualizes the entire flow of data on an infinite canvas, you gain a clear view of your startup’s potential.
Entrepreneurs and analysts should look to move away from static templates and start modeling their business logic transparently. With the ability to combine code, data, and financial structures in one place, you can build a feasibility study that not only secures funding but also serves as a roadmap for growth.
Try Quadratic to build your next financial model on an infinite canvas.
Use Quadratic to Build a Sports Facility Booking System Financial Model
- Build complete financial models on an infinite canvas: Consolidate all inputs, logic, and outputs for your sports facility booking system in one transparent workspace, eliminating "black box" models.
- Integrate market data visually: Place total addressable market data and financial assumptions side-by-side to quickly validate projections and ensure realism.
- Code complex revenue logic with Python: Handle intricate revenue recognition rules (e.g., booking vs. play dates) using clean Python scripts directly in the sheet, replacing brittle formulas.
- Localize your model with ease: Adapt your feasibility study for global markets with flexible support for local currencies and right-to-left text.
- Visualize the entire business flow: Map facility registrations to revenue and cash flow, seeing the cause-and-effect of every business decision in a single, logical view.
- Analyze profitability with live data: Connect to databases via SQL to compare actual booking numbers against financial forecasts for precise break-even and runway analysis.
Ready to build a transparent and robust financial model for your sports facility booking system? Try Quadratic.