
James Amoo, Community Partner
Feb 11, 2026

For many analysts, automatic formatting in spreadsheets can be both rewarding and frustrating at the same time. On one hand, features like automatic formatting in Excel allow you to quickly style a table or highlight trends without manually coloring every cell. On the other hand, Excel’s aggressive automation often leads to frustration, converting account numbers into scientific notation or turning ID strings into date formats against your will.
More importantly, most native Excel formatting tools suffer from a persistence problem. You might spend hours perfecting a report, only to have the formatting break the moment you paste new data or refresh a SQL connection. Spreadsheet automation shouldn't just mean applying a style once; it should mean defining a rule that persists regardless of how your data changes.
In this guide, we will cover the standard native methods involved in automatic formatting Excel spreadsheets, and then introduce a more durable, AI-powered workflow designed for repeatable reporting.
How to automatically format cells in Excel
In this section, we will discuss the several methods to automatically format cells in Excel, helping you to speed up the visual presentation of your data.
Excel offers three primary tiers of automation to help with formatting. While these tools are useful for ad-hoc analysis, it is important to understand that they are only automatic primarily in their initial application, not necessarily in their long-term maintenance.
Method 1: Format as table
The most straightforward way to automatically format Excel spreadsheet ranges is the "Format as Table" feature. Located in the Home ribbon (or accessible via Ctrl + T), it converts a standard range of cells into a structured Excel Table.
This feature automatically applies banded rows (alternating colors), adds filter buttons to headers, and ensures that if you type directly below the table, the formatting expands to include the new row. It is a quick way to make a dataset readable.
A major drawback of this method is that it imposes a rigid structure. This means that if your reporting requires custom headers, specific merged cells, or a layout that doesn't conform to a strict database grid, tables can become restrictive and difficult to manipulate.
Method 2: Automatic conditional formatting
For dynamic data visualization, automatic conditional formatting Excel spreadsheets is the go-to method. Instead of painting a cell a static color, you define rules based on the cell's value. For example, you can set a rule to highlight all sales figures below a certain margin in red or add data bars that visually represent the magnitude of a number.
This method is dynamic because it reacts to data changes within the cell. If a value changes from 100 to 50, the color updates instantly. The limitation, however, lies in performance and fragility. Heavy use of conditional formatting can significantly slow down large workbooks.
Furthermore, the rules are tied to specific cell ranges. If you paste data over that range or insert rows incorrectly, the rules often fragment, leaving you with a patchwork of formatting that requires manual repair.
Method 3: Custom number formats
Sometimes, automatic formatting in Excel refers to controlling how data types appear or preventing Excel from changing them. By default, Excel tries to guess your data type, which causes the infamous issue of gene names (such as SEPT2 or MARCH1) or credit card numbers being converted to dates or scientific formulas.
Using Custom Number Formats (accessible via Ctrl + 1), you can pre-define cells as "Text" to stop this auto-correction, or create custom masks (like phone number formatting) that change how data looks without changing the underlying value. While effective for data integrity, this is a defensive measure rather than a tool for automating or summarizing reports.
Why Excel’s automatic formatting often fails
The core thesis of the formatting problem is simple: Excel treats formatting as a layer of paint applied on top of a grid, rather than a logical rule attached to the data pipeline. This leads to what we call the "Persistence Problem."
When you use Excel automatic formatting tools, they are generally tied to specific grid coordinates (e.g., A1:D100). For example, if next week's data export contains 150 rows, the bottom 50 rows will likely lack the formatting you applied previously. You then have to manually drag the "paint" down to cover the new data.
Similarly, refreshing data from external sources like databases often wipes out manual styling entirely. The "automatic" aspect fails because the spreadsheet doesn't understand that the formatting belongs to the data, not the cells. This forces analysts into a loop of endless rework, re-formatting the same weekly report every Monday morning because the styles didn't stick to the underlying logic of the dataset.
While Excel formatting automation works well for small to medium datasets, it often becomes a bottleneck with large volumes of data. Analysts handling complex, high-scale workloads need a true Excel alternative to keep up with growing demands.
Formatting automation with Quadratic AI
For users who need formatting to be a repeatable step in a workflow rather than a manual finishing touch, the solution lies in treating formatting as logic. This is where Quadratic, an AI-powered data analysis software, stands out.
Quadratic allows you to move from clicking buttons to defining rules. It is also a coding spreadsheet with native support for modern programming languages like Python and SQL. This means that formatting can be handled programmatically or simply by asking questions using natural language queries. This ensures that your presentation layer is just as durable as your data layer.
Persistent formatting with data refresh
Quadratic allows you to work directly with data frames and structured tables that exist as code objects. When you apply formatting rules to these structures, the formatting persists regardless of how the data changes.
Quadratic connects directly to multiple databases, raw data, and APIs. So, if a report pulls 100 rows this week and grows to 1,000 rows next week, your formatting logic scales seamlessly with the dataset.
There is no need to drag format painters or check if conditional formatting ranges have fragmented. The report generates instantly without the manual data cleaning phase required in traditional spreadsheets like Excel and Google Sheets
Data formatting with AI
You don't necessarily need to learn Python or SQL for data analysis to format your data. Quadratic’s built-in AI allows you to use plain text queries to define complex styling rules. You can simply prompt the AI: "Make all rows where variance is negative red and bold, and format the date column as YYYY-MM-DD."
Quadratic AI translates this request into a persistent rule. Unlike Excel's conditional formatting menus, which require navigating multiple dialog boxes and managing rule precedence, formatting in Quadratic creates a clear and reusable logic that can be used across your dataset. Once the rule is set, it automatically applies to all future data updates.
Let’s see how this works. First, I import my data into Quadratic:
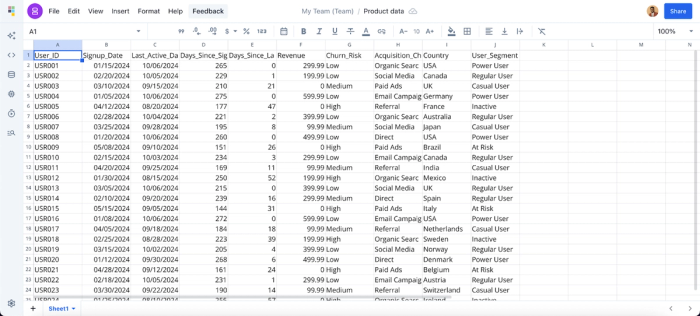
Suppose I want to format rows with a high churn risk:
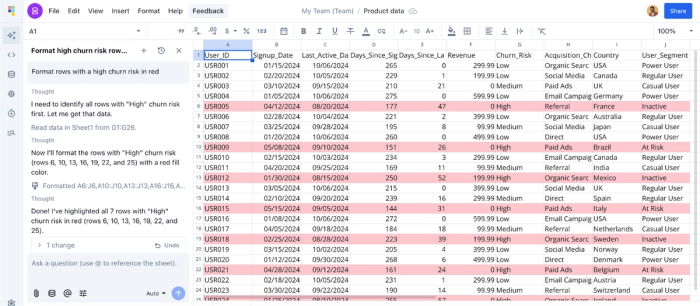
In the image above, I simply prompt Quadratic AI, “Format rows with a high churn risk in red”, and it automatically scans my dataset and formats it accordingly.
Excel vs Quadratic for automated reporting flows
In this section, we’ll compare Excel and Quadratic, helping you choose the best tool for automatic data formatting.
Maintenance
Excel is excellent for quick, one-off sheets where the data will not change significantly. Formatting in Excel is a "paint" layer. It sits on top of the cells and is easily scraped off or misaligned when new data is pasted or imported. It requires high maintenance for recurring reports because the user acts as the manual bridge between the raw data and the final look.
Quadratic is built for recurring reports and data pipelines. Because the spreadsheet understands the logic of the data (via Python/SQL), the formatting expands and contracts dynamically, supporting true data analytics modernization. This drastically reduces the rework time for operations and finance analysts, allowing them to focus on analysis rather than aesthetic repair.
Scalability
As mentioned earlier, Excel’s cell formatting works well for small to medium-sized datasets, but often slows down or becomes unresponsive as data volumes grow, especially with frequent refreshes from connected databases. Analysts are also forced to repeatedly adjust or rewrite formatting logic to accommodate new data.
Quadratic, by contrast, is built to handle large-scale datasets efficiently, automatically applying formatting to new data without performance issues.
AI formatting
While Excel offers automatic formatting features, it still requires significant manual setup and ongoing adjustments, which can be time-consuming, especially when defining complex formatting rules. Excel AI also does not solve this problem, as it struggles to scale beyond small tasks.
Quadratic removes this friction with AI-powered formatting, allowing users to apply formatting simply by asking questions. It also generates reusable logic that can be reviewed, modified, and reused.
Conclusion
Excel’s native tools are useful for ad-hoc tasks, but they are often too fragile for critical, recurring reporting. When automatic formatting Excel features fail to persist after a data refresh, they turn into a liability that costs hours of manual repair time. True automation requires a tool that treats formatting as persistent logic, not just decoration.
By shifting to a platform where formatting rules are tied to the data pipeline, you can stop fixing broken spreadsheets every week and trust that your reports will look correct the moment the data updates.
Quadratic offers true automation in your spreadsheet and allows you format your data with ease. Try Quadratic for free today.
Frequently asked questions (FAQs)
How can I automate Excel formatting without writing complex formulas?
You can use conditional formatting rules, Excel tables, Power Query, or VBA macros. However, these still require technical setup and frequent maintenance when new data is added, or structures change.
What is an AI-powered alternative to Excel formatting?
AI-powered tools like Quadratic automate formatting using natural language instead of manual rules. Users can simply describe how they want data formatted, and the system generates scalable, reusable logic automatically.
How does Quadratic automate spreadsheet formatting?
Quadratic connects directly to databases, APIs, and raw data sources and applies formatting dynamically as new data arrives. Its AI formatting feature lets users request formatting through simple prompts while producing logic that can be reviewed, modified, and reused.