Understanding the Fourier Series Calculator template
This template is designed to decompose periodic signals into their constituent sine and cosine waves, providing a clear window into signal processing mathematics and serving as an excellent example of software for data analysis. By utilizing Python for real-time computation, the tool visualizes the direct relationship between time-domain signals and their frequency-domain spectra.
Users can observe how complex waveforms are constructed from simple harmonic components. The template demonstrates signal reconstruction fidelity, allowing users to see how increasing or decreasing the harmonic count affects the accuracy of the approximation.
Input configuration and parameters
The input section, located in cells A1:B9, allows for precise control over the signal generation and analysis parameters.
- Period and sampling: Users define the signal period ($T$) and the total sample count ($N$) to establish the resolution of the analysis (defaulting to 256 samples).
- Harmonic control: The "Max Harmonics ($K$)" setting limits the calculation depth, determining how many terms are included in the series expansion.
- Signal selection: A dropdown menu enables the selection of standard signal types, such as square waves, or allows for custom data entry.
- Customization: Toggles are available to switch between standard wave generation and custom data input, as well as options to filter specific harmonic indices.
How the template calculates Fourier series coefficients
A native Python script drives the core logic of the template, generating the Fourier_Coefficients table that spans cells A12:F34. This script computes the discrete Fourier coefficients based on the user-defined sample points.
- Coefficient breakdown: The table displays the harmonic index ($n$), the corresponding frequency in Hz, cosine coefficients ($a_n$), and sine coefficients ($b_n$).
- Magnitude derivation: The script calculates the magnitude from the coefficient pairs to determine the spectral strength of each harmonic.
- Filtering logic: The "Included" column serves as a boolean indicator, showing which harmonics are currently participating in the signal reconstruction based on the user's "Max Harmonics" limit.
Visualizing signal decomposition
The template provides two distinct visualizations to interpret the mathematical results. These charts are automatically generated by Python and update instantly when input parameters change.
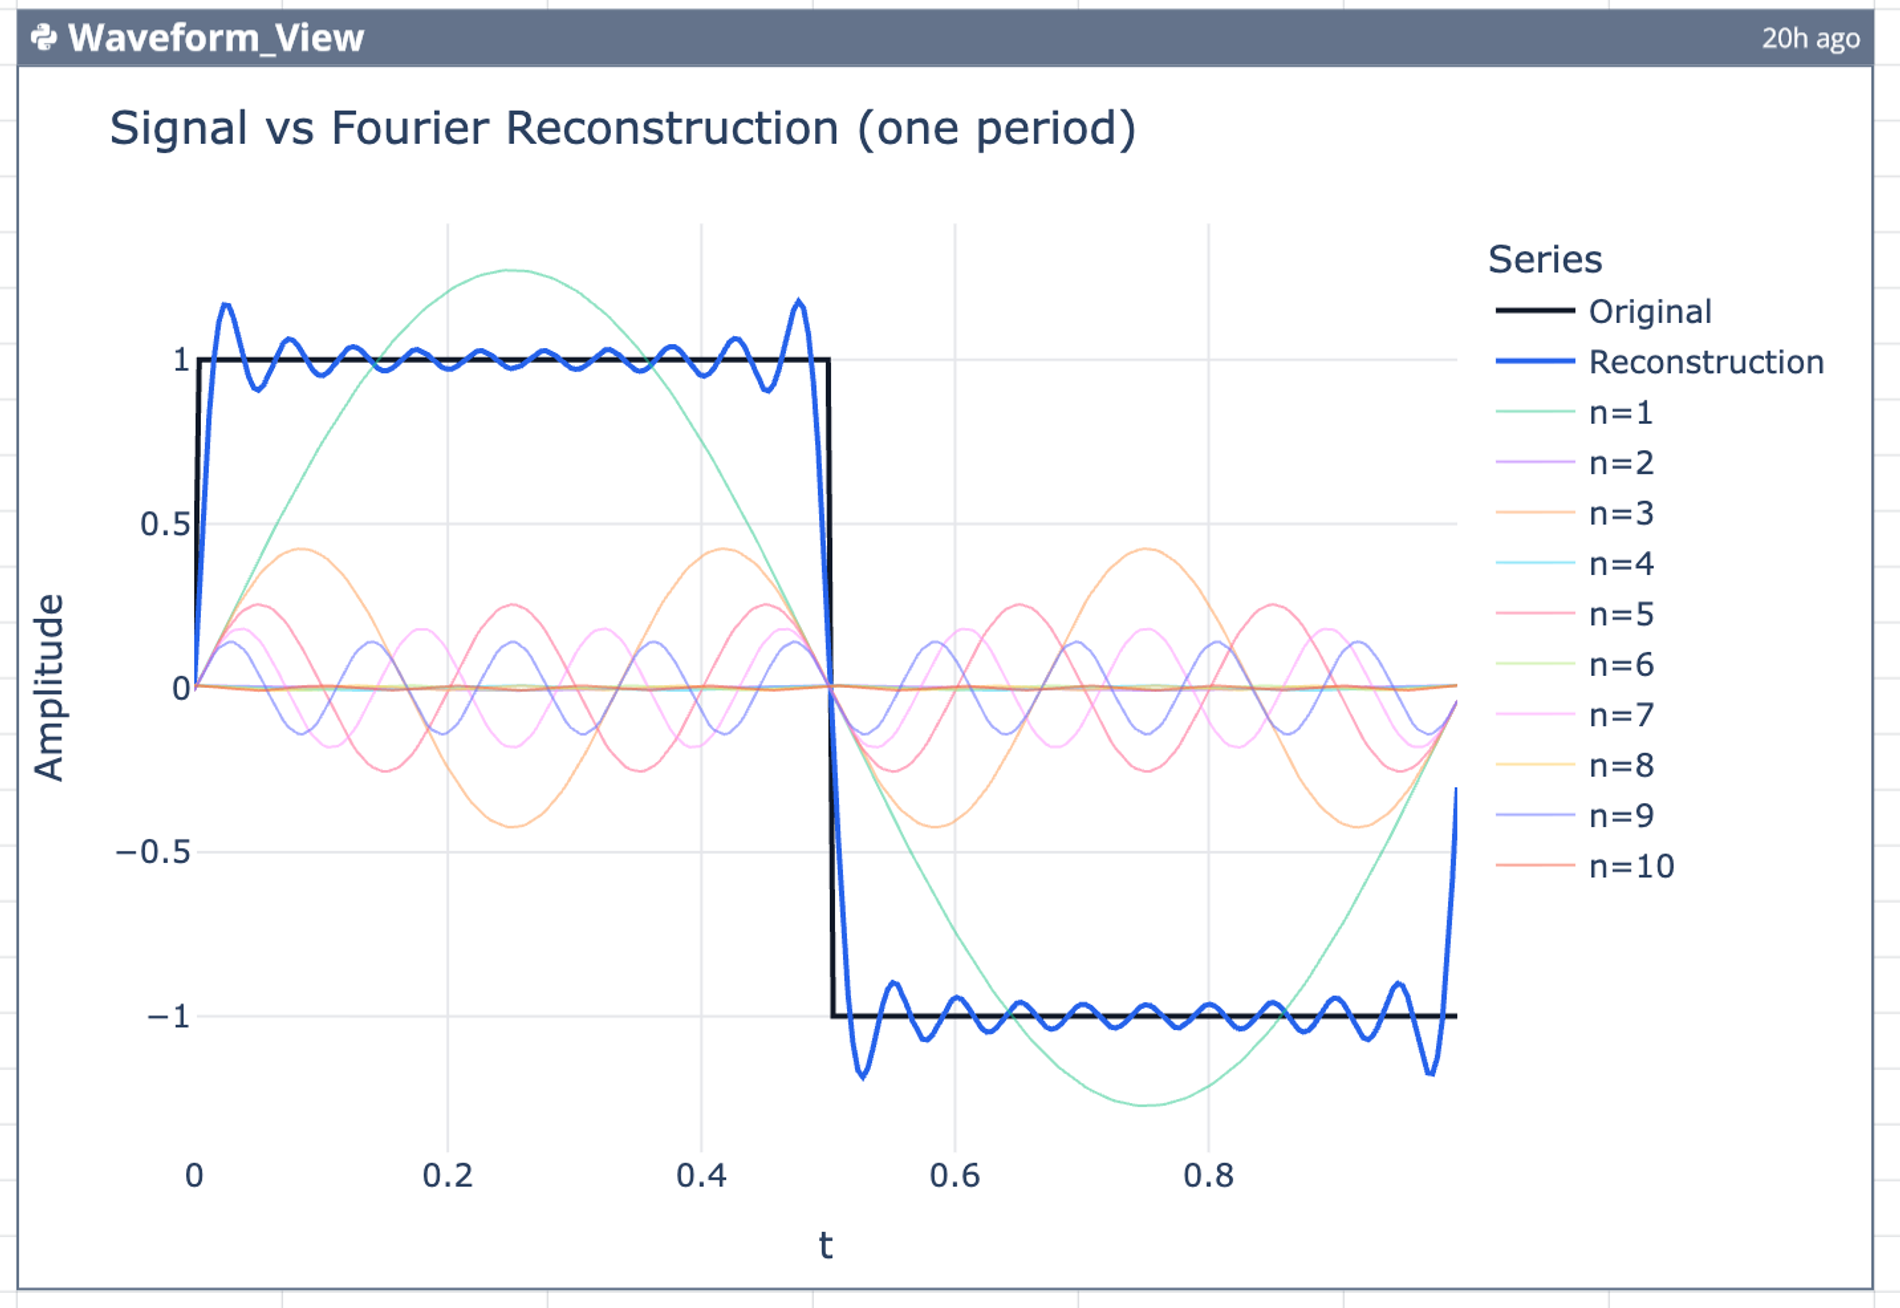
- Waveform view: The
Waveform_Viewchart (H12:N34) renders the time-domain representation. It plots the original signal alongside the reconstructed signal, visually demonstrating the approximation quality. - Spectrum analysis: The
Spectrum_Viewchart (H36:N58) displays the frequency-domain magnitude spectrum, showing the amplitude of each harmonic frequency. - Dynamic updates: Both visualizations react immediately to modifications in column B, allowing for rapid iteration and exploration, much like what you'd expect when you create a dashboard in python.
Workflow: Using the fourier series expansion calculator
To effectively use this template for signal analysis, follow this logical progression:
- Setting parameters: Begin by entering the desired period and sample count in the input grid to initialize the resolution.
- Selecting signal types: Choose a standard wave form (e.g., square wave) or input custom data to calculate fourier series coefficients.
- Analyzing coefficients: Review the generated table to observe how the fourier series coefficients calculator populates the $a_n$ and $b_n$ values for each harmonic index.
- Interpreting results: Look for specific mathematical behaviors, such as odd harmonics dominating the expansion of a square wave while even harmonics remain negligible.
- Refining the model: Adjust the "Max Harmonics" value to observe the convergence of the fourier sine series calculator or cosine components, noting how the reconstructed waveform sharpens as more harmonics are added.
Who this Fourier Series Calculator is for
- Engineering students: For visualizing and interacting with the abstract mathematical concepts behind signal processing and series expansion.
- Data analysts: For decomposing periodic time-series data into frequency components to identify underlying cycles, a skill often used in predictive modeling and analytics.
- Math educators: For demonstrating the mechanics of a fourier series expansion calculator in a live classroom setting without relying on static textbook diagrams.
- Researchers: For quickly prototyping signal reconstruction scenarios and testing harmonic filtering without writing complex code from scratch.
Use Quadratic to do Fourier Series Analysis
- Decompose periodic signals into their constituent sine and cosine waves.
- Calculate discrete Fourier coefficients using native Python for real-time results.
- Instantly visualize both time-domain waveforms and frequency-domain spectra.
- Precisely control signal parameters, including period, sampling, and harmonic count.
- Iteratively refine signal reconstruction by adjusting the number of included harmonics.