
Table of contents
- Why is my balance sheet not balancing? (The usual suspects)
- The scenario: Auditing a multi-year financial model
- Step 2: Diagnosing liability and equity logic
- Step 3: Fixing the formula for structural integrity
- Conclusion: From debugging to auditability
- Use Quadratic to resolve balance sheet formula errors
There is a specific kind of panic reserved for financial professionals. It hits when you are finalizing a model, perhaps minutes before a board meeting or a filing deadline, and your "Check" line—the one that is supposed to read zero—shows a variance. You stare at the screen, but the numbers blur. You know the accounting equation must hold true, yet your balance sheet not balancing suggests otherwise.
For most modelers, whether working on a balance sheet or a budget format for an event, the immediate reaction is to start tracing precedents, auditing cell by cell, and hunting for a hardcoded number buried in a summation range. Adhering to financial modeling best practices can help prevent such issues. For most modelers, whether working on a balance sheet or a budget format for an event, the immediate reaction is to start tracing precedents, auditing cell by cell, and hunting for a hardcoded number buried in a summation range. In this use case, a finance professional was managing a detailed multi-year financial statement model, which could be a startup financial model.
Why is my balance sheet not balancing? (The usual suspects)
Before diving into structural fixes, it is worth addressing the common culprits that trigger high-intent searches during close periods. When a model breaks, the error usually falls into one of three categories: signage, omission, or classification.
Signage errors are frequent when linking the P&L to the balance sheet. If a net loss is entered as a positive number in the equity section without flipping the sign in the formula, the balance sheet will be off by exactly double that amount.
Omission errors occur when SUM() ranges fail to capture new rows. This often leads to questions about which account does not appear on the balance sheet. In a broken model, the answer might be an account that should be there—like a new accrual line added at the bottom of a range—but was excluded because the formula wasn't dynamic. Conversely, accidental inclusion of P&L items (like Revenue) directly into the balance sheet totals will also cause immediate breaks.
Classification confusion can also lead to formula errors. Junior analysts might wonder where is a note receivable reported in the balance sheet (it is a non-current or current asset) versus notes payable on the balance sheet (a liability). If a formula for "Total Liabilities" accidentally grabs an asset line because of poor row grouping, the model will never balance.
While these are standard checks, the most frustrating errors are the ones that persist even after you have verified the signs and the account mapping. That is where we move from checking accounting principles to auditing data logic.
The scenario: Auditing a multi-year financial model
In this use case, a finance professional was managing a detailed multi-year financial statement model, which could be a startup financial model. The model included granular line items for assets, liabilities, and equity across a five-year forecast.
The problem was a persistent variance in the "Check" row. The total assets did not equal total liabilities plus equity for years three through five. The user wasn't just trying to plug a number; they needed to audit the flow of data to ensure the integrity of the forecast, a key aspect of financial risk analysis. The user wasn't just trying to plug a number; they needed to audit the flow of data to ensure the integrity of the forecast.
In a standard spreadsheet, this requires clicking into individual cells to ensure the logic copied across correctly. In Quadratic, the user took a different approach. By importing the data into a workspace that supports Python and SQL alongside standard formulas, they could audit the logic rather than the grid.
Step 1: Isolating the variance
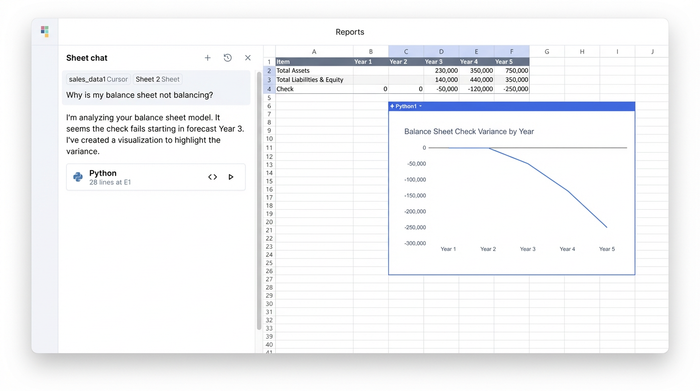
The first step in resolving a broken model is to isolate exactly where and when the balance sheet does not balance. In a traditional workflow, you might calculate the difference in a helper row and drag it across all columns.
Using Quadratic, the user was able to view the dataset as a whole. Instead of checking cell C50, then D50, then E50, they used Python to calculate the delta for the entire dataframe instantly. This confirmed that the accounting equation (Assets = Liabilities + Equity) held true for the historical data in years one and two, but broke immediately in the first forecast year.
This immediate visualization of the variance allowed the user to rule out historical data entry errors and focus entirely on the forecasting logic.
Step 2: Diagnosing liability and equity logic
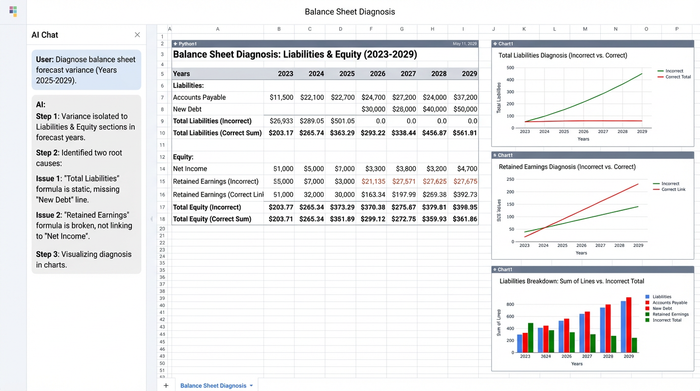
With the variance isolated, the user drilled down into the components. By comparing the sum of the parts against the totals, they identified that the error stemmed from two specific areas: the debt schedule and the retained earnings roll-forward.
The first issue involved specific liability line items. The user had recently added a new tranche of debt to the model. When verifying notes payable on a balance sheet, it is critical that the summation logic for "Total Non-Current Liabilities" expands to include new rows. In this case, the legacy formula was static. It was summing rows 40 through 45, but the new notes payable on the balance sheet sat on row 46.
The second issue was in the Equity section. The link between Net Income (flowing from the P&L) and Retained Earnings had broken in the transition from actuals to forecast. The formula was pulling "Net Income" from the wrong row in the forecast columns, causing the balance sheet to drift further out of balance with each subsequent year.
Step 3: Fixing the formula for structural integrity
Identifying the error is half the battle; fixing it so it never happens again is the goal. In a traditional spreadsheet, the user would correct the SUM() range in one column and drag it across, hoping they didn't overwrite a necessary hardcode or break a different link.
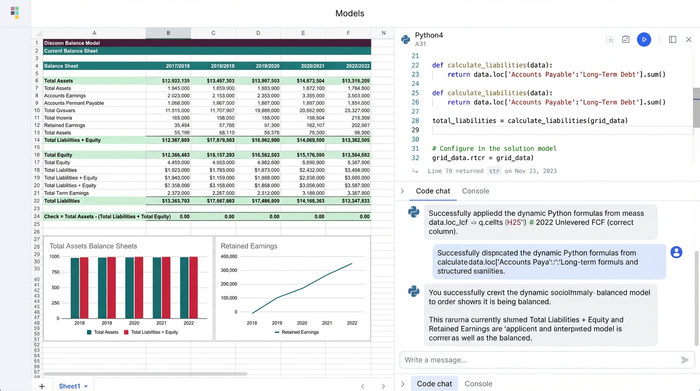
This is the "Quadratic opportunity." Because Quadratic allows for code-based formulas and object-oriented modeling, the user didn't have to patch individual cells. They updated the logic for "Total Liabilities" to dynamically sum the relevant category, regardless of how many new rows were added.
Similarly, they wrote a clean, consistent formula for the Retained Earnings roll-forward (Previous Year RE + Current Year Net Income - Dividends) that applied to the entire forecast timeline automatically.
While this scenario focused on a corporate structure, the same rigorous logic applies to other entities, such as those requiring a current expected credit loss model. The check row returned to zero across all fiscal years. More importantly, the user had confidence that adding a new liability line in the future wouldn't silently break the model again, which is crucial for complex tasks like product profitability analysis.
Special contexts: Non-profits and complex models
While this scenario focused on a corporate structure, the same rigorous logic applies to other entities, such as those requiring a current expected credit loss model. For example, a not-for-profit balance sheet (often called a Statement of Financial Position) relies on the equation Assets = Liabilities + Net Assets.
In non-profit modeling, "Net Assets" functions similarly to Equity. The complexity often arises when tracking restricted versus unrestricted funds. A breakage here is just as critical as in a corporate model. By using a tool that prioritizes data structure over manual cell entry, non-profit finance teams can ensure that their restricted fund releases are calculated correctly without manually tracing dollar flows across dozens of tabs.
Conclusion: From debugging to auditability
A balance sheet not balancing is rarely just a math error; it is a signal that your model is fragile. When you rely on manual cell references and static ranges, you force yourself to hunt for needles in haystacks every time the data changes.
By moving your financial models into Quadratic, you transition from manual debugging to structural auditability. Instead of spending your close cycle panic-fixing broken links, you can spend it performing financial data analysis to understand the story the numbers are telling. Instead of spending your close cycle panic-fixing broken links, you can spend it analyzing the story the numbers are telling.
If you are tired of wondering why your check figure isn't zero, try importing your model into Quadratic to visualize the disconnects and fix them permanently.
Use Quadratic to resolve balance sheet formula errors
- Quickly identify and isolate balance sheet variances across multiple years using Python, eliminating tedious cell-by-cell auditing.
- Diagnose formula errors in complex financial models, such as static
SUM()ranges or broken P&L links, with a holistic data view. - Implement dynamic, code-based formulas that automatically adjust for new rows or changes, ensuring your balance sheet always balances.
- Build structurally sound financial models where logic is consistently applied, preventing future breaks when adding new accounts or forecasts.
- Shift from manual debugging to confident model auditability, freeing up time for financial analysis instead of error-hunting.
If you're ready to stop panic-fixing your financial models and start building them with confidence, try Quadratic.