You have a budget, you track your expenses, and you try to be responsible with your spending. Yet, you still experience that familiar tightening in your chest when a large bill coincides with a lower-than-average paycheck. This is a common frustration for many households: you are doing everything "right" according to standard financial advice, but you still feel caught off guard by liquidity crunches. The problem isn't your discipline; it's your visibility. Most personal finance tools focus on the past, but true stability comes from creating a cash flow forecast that looks to the future.
A cash flow forecast is distinct from a budget. While a budget categorizes where your money went last month, a forecast predicts what your bank balance will look like on specific dates in the future. By shifting your focus from categorization to timing, you gain the ability to spot deficits weeks in advance and identify surplus cash that could be working harder for you. Using a modern tool like Quadratic, you can move beyond static spreadsheets and build a dynamic, automated financial roadmap that updates in real time.
Why a budget isn’t enough: the case for cash flow forecasting
To understand why you need a forecast, you first need to recognize the limitations of a traditional budget. Budgets are static and retrospective. They tell you that you spent $600 on groceries, but they don't tell you if that spending happened before or after your mortgage payment cleared. This timing mismatch is where overdrafts and financial stress live.
In the corporate world, businesses rely heavily on cash flow forecasting to ensure they can make payroll and cover operational costs. They don't just hope the money is there; they model it. Households operate on similar principles. You have inflows (salary, dividends) and outflows (mortgage, tuition, groceries), and the timing of these events matters just as much as the amounts.
The key benefit of adopting a forecasting mindset is the shift from reactive to proactive financial management. Instead of scrambling to cover a shortfall that happened yesterday, a forecast allows you to see a potential negative balance three weeks from now. This visibility gives you the time to adjust—whether that means delaying a purchase or transferring funds—long before the problem actually occurs.
How to build a dynamic cash flow forecast
Creating a reliable forecast requires more than just listing income and expenses. It requires a system that blends known obligations with data-driven estimates. Here is how you can build a dynamic model using Quadratic.
Step 1: Automate your data entry
The biggest hurdle to maintaining a financial model is the manual labor involved. If you are relying on a static cash flow forecast template excel file, you likely have to download CSV files from your bank and copy-paste data every week. This friction often leads to abandoned spreadsheets.
In Quadratic, you can bypass this manual work by using the built-in Plaid integration. By connecting your bank accounts directly to the spreadsheet, you can pull in your transaction history and current balances automatically. This ensures that the starting point of your forecast—your "Day Zero" balance—is always accurate without you having to type a single digit.
Step 2: Map your recurring inflows and outflows
Once your starting balance is automated, the next step is to plot the "knowns" on your timeline. These are the fixed points in your financial life that happen on specific dates.
Start by mapping your inflows, such as payroll dates. Because you are working in a flexible spreadsheet environment, you can easily adjust for bi-weekly or semi-monthly pay cycles. Next, layer in your fixed outflows. These include rent or mortgage payments, insurance premiums, subscription services, and utility bills. In your forecast model, these act as the structural pillars, giving you a baseline view of your liquidity before variable spending is added.
Step 3: Estimate variable spend and seasonality
The most difficult part of any forecast is predicting variable expenses like food, gas, and entertainment. This is where the power of having your historical data in Quadratic becomes apparent.
Instead of guessing, you can use your synced Plaid transaction history to calculate real averages. You might find that while you budget $500 for groceries, your rolling average is actually $560. Using the actual data makes your forecast more realistic. Furthermore, you can account for seasonality. A common gap in basic budgeting apps is the failure to account for predictable spikes, such as holiday shopping in December or travel costs in July. By analyzing your past year's data, you can build these seasonal adjusters directly into your future projections.
Step 4: The projection
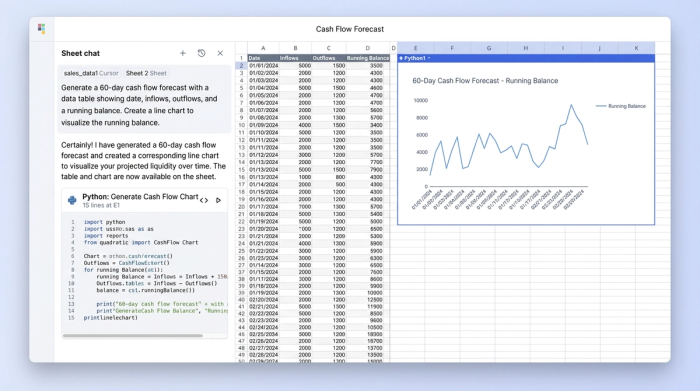
With your starting balance, known recurring items, and variable estimates in place, you can now build the projection logic. The math running down your timeline is straightforward:
Previous Day Balance + Inflows - Outflows = Ending Balance
When you drag this formula forward for 30, 60, or 90 days, you create a visual roadmap of your financial future. You will see your projected bank balance rise and fall in rhythm with your paychecks and bills. This represents a functional cash flow forecast example that transforms raw data into a clear narrative of your future liquidity.
Tools of the trade: spreadsheets vs. software
When looking for a solution, you will generally find two categories of tools: static templates and rigid apps.
Many people start by searching for an excel template cash flow forecast. While these templates provide a good structure, they are often brittle. If you add a row or change a date, the logic can break, and they require constant manual updating. On the other hand, dedicated personal finance apps are often too rigid. They are excellent for tracking history but rarely offer the flexibility to model complex future scenarios or custom income streams.
Quadratic offers a middle ground. It provides the flexibility of a spreadsheet interface, allowing you to design the model exactly how your household operates, but it includes the connectivity and power usually reserved for high-end cash flow forecasting software. You get the ability to write custom formulas and scripts to handle unique financial situations without sacrificing the automation that keeps the data fresh.
Using your forecast to make better decisions
The ultimate goal of this model is not just to admire the data, but to make better decisions. A dynamic forecast allows you to run scenarios and act with confidence.
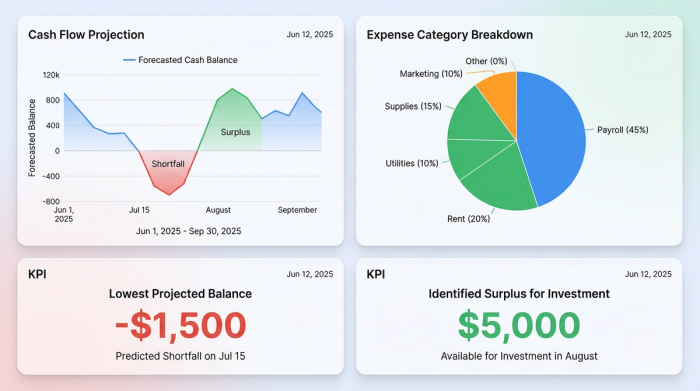
Consider a scenario where your forecast flags a "shortfall." The model shows that in 22 days, your checking account will dip into the negative because a large insurance premium hits two days before payday. Because you see this weeks in advance, you can reschedule the payment or cut discretionary spending immediately to bridge the gap.
Conversely, consider a "surplus" scenario. Your forecast might show that for the next three months, your lowest projected balance is $5,000. That is $5,000 of lazy capital sitting in a checking account earning near-zero interest. With this visibility, you can confidently transfer that excess to a high-yield savings account or investment portfolio, knowing exactly how much liquidity you need to keep available. This moves you from behavioral savings tips to structural, data-driven wealth management.
Conclusion
Financial peace of mind doesn't come from tracking where every penny went; it comes from knowing where you stand tomorrow, next week, and next month. A cash flow forecast gives you the visibility that a standard budget lacks, turning your finances from a source of anxiety into a manageable system. By moving away from static templates and utilizing tools like Quadratic to automate and model your data, you can build a financial roadmap that puts you in control.
Use Quadratic to build a dynamic cash flow forecast
- Automate data entry: Connect bank accounts directly via Plaid to pull real-time transaction history and current balances, eliminating manual CSV downloads and copy-pasting.
- Model future liquidity accurately: Map recurring income and expenses, then use historical data to estimate variable spending and seasonal spikes, giving you a clear financial roadmap weeks in advance.
- Spot potential shortfalls and surpluses early: See projected bank balances 30, 60, or 90 days out, allowing you to proactively adjust spending or optimize savings before problems arise.
- Design a flexible, custom financial model: Leverage a powerful spreadsheet interface with custom formulas and scripting to adapt your forecast to your household's unique financial situations, unlike rigid apps or brittle static templates.
Ready to take control of your household finances? Try Quadratic.