Marketing teams frequently find themselves in a familiar, frustrating scenario. The monthly report shows record-breaking lead volumes, high click-through rates, and low cost-per-acquisition. Yet, the sales team is unhappy, citing poor lead quality and missed revenue targets. This disconnect is the often-cited Attribution Gap, and it exists because standard web analytics only tell half the story. They track what happens on the website, but they lose sight of the user the moment the conversation moves offline.
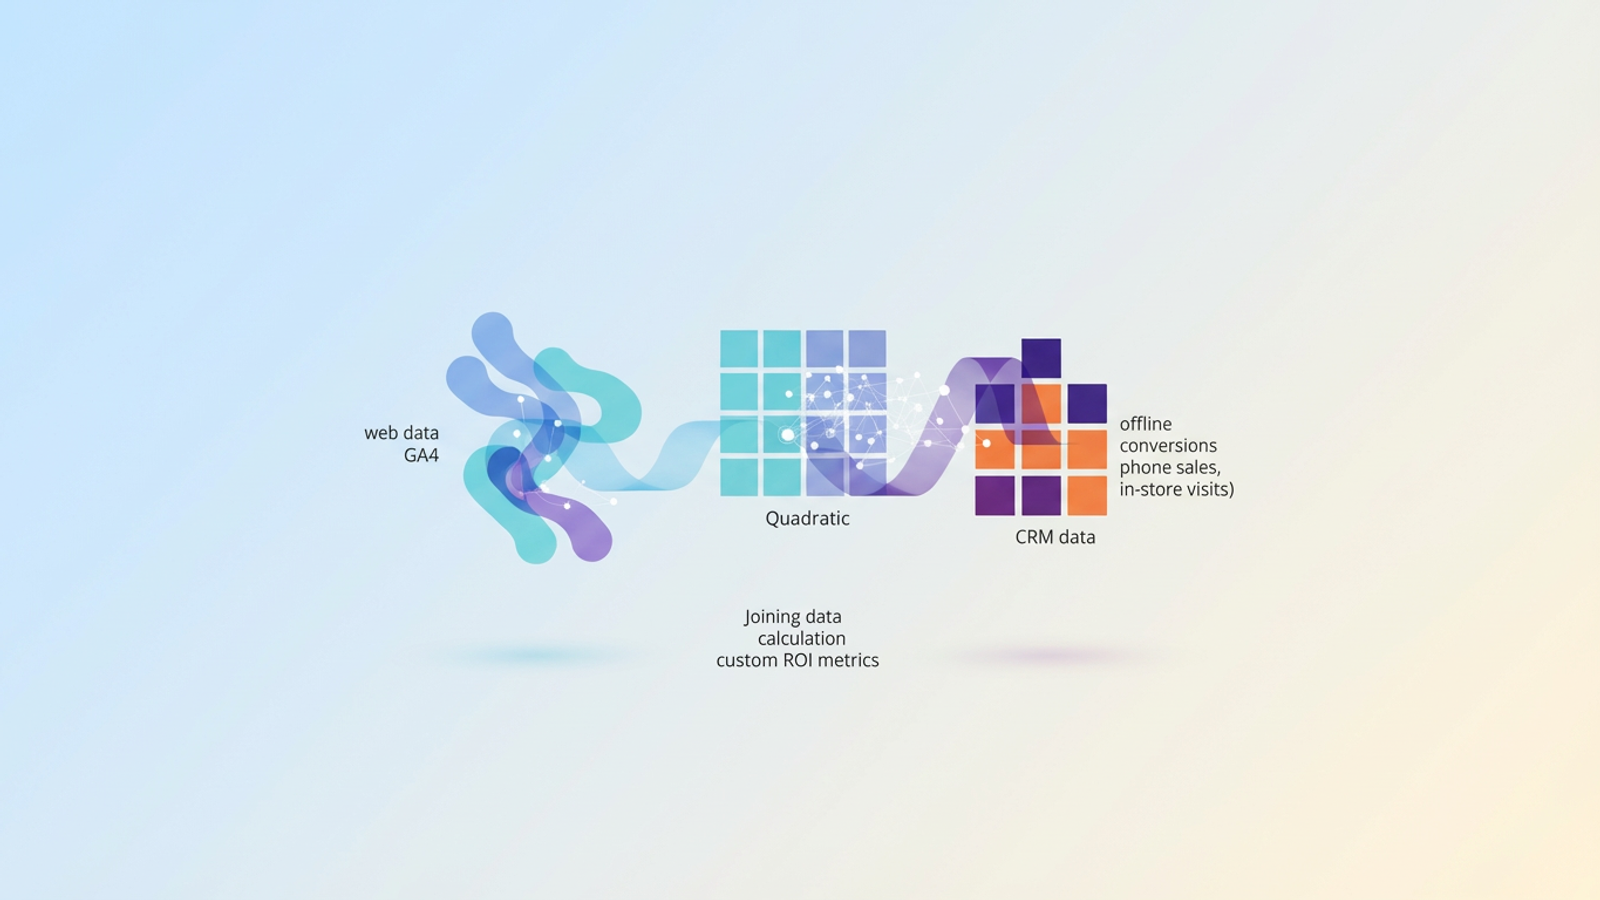
To solve this, data-driven teams turn to Google Analytics offline conversions. In the context of digital analytics, this term refers to tracking value that occurs off-site—such as closed deals in a CRM, phone sales, in-store visits, or finalized contracts—and connecting that value back to the initial digital touchpoint.
The problem is that merging these two worlds is notoriously difficult. Teams often resort to opaque attribution tools that operate as "black boxes," or they struggle with fragile, manual spreadsheets that break as soon as the dataset grows. True ROI isn't found just by configuring a tag or relying on default reports; it is found by joining your web data with your CRM data to calculate custom performance metrics. This post explores how to bridge that gap using Quadratic to analyze your data with precision and flexibility.
The "Attribution Gap" in modern reporting
Relying solely on standard web conversions is a dangerous strategy for B2B companies or high-ticket B2C brands. A form fill, a whitepaper download, or a "Contact Us" submission is merely a signal of intent, not a guarantee of revenue. If you optimize your marketing spend based only on these top-of-funnel signals, you risk pouring budget into campaigns that generate noise rather than value.
This is why offline conversion tracking Google Analytics is critical for a holistic view of the customer journey. Without it, you cannot distinguish between a lead that went cold after one email and a lead that signed a six-figure contract three months later.
Standard GA4 reports miss the metrics that actually matter to the C-suite. They can tell you the conversion rate of a landing page, but they cannot show you the Lead-to-Close rate by channel. They track goal value based on static assumptions, but they miss the Average Contract Value (ACV) or the actual realized revenue compared to the projected goal. To report on ROI effectively, you need to see the end of the story, not just the beginning.
Why native GA4 data import is only half the solution
If you search for how to solve this problem, the standard advice is almost always to import offline conversions Google Analytics directly into the platform. This usually involves formatting CSV files to rigid specifications or setting up the Measurement Protocol to ping GA4 when a CRM event occurs.
While sending data back into GA4 is highly beneficial for automated ad bidding (like Google Ads Smart Bidding), it is often insufficient for deep analysis. GA4 is designed primarily as a collection and reporting tool, not a business intelligence platform.
The native import features come with significant limitations. First, the platform is rigid; once data is processed, you generally cannot change attribution logic retroactively. Second, it lacks transparency. You cannot easily see the underlying calculation of how a specific offline event was matched to a specific session ID. Finally, debugging integration errors inside GA4 is difficult, often leaving analysts guessing why certain conversions aren't populating.
There is a better way. Instead of forcing your CRM data into GA4’s pre-built reports, you can pull your web data out and analyze it alongside your offline data in a flexible environment. This allows you to audit the connections, run complex queries, and visualize the results without the constraints of a standard analytics interface.
A better workflow: analyzing offline conversions in Quadratic
Quadratic offers a unique solution for this workflow. As an AI-powered spreadsheet that runs native Python and SQL alongside standard formulas, it acts as an infinite canvas for data analysis. It combines the ease of use of a spreadsheet with the data-joining power of a technical notebook. This makes it the ideal middle ground for RevOps teams who need to merge disparate datasets without building a complex data warehouse.
Here is how a revenue operations team can use Quadratic to close the loop on attribution.
1. Consolidating your data sources
The first step is getting the raw data onto the same grid. From GA4, you export your traffic data, ensuring you include the essential join keys: User IDs and Client IDs (the ga_client_id). Along with these identifiers, you pull the acquisition dimensions—Campaign, Source, Medium, and Landing Page.
Simultaneously, you export your offline data from your CRM (Salesforce, HubSpot, or Pipedrive), keeping in mind CRM data quality best practices. This export should include the Deal Stage, Closed Revenue amount, Lead Status, and the corresponding Lead ID or Client ID that was captured during the initial form fill. Bringing these two sources into Quadratic prepares the foundation for granular offline conversions GA4 analysis.
2. Joining web traffic with CRM outcomes
In a traditional spreadsheet, joining these two datasets would require fragile VLOOKUP or INDEX-MATCH formulas. If the data isn't perfectly sorted or if there are duplicate entries, these formulas often break or return errors.
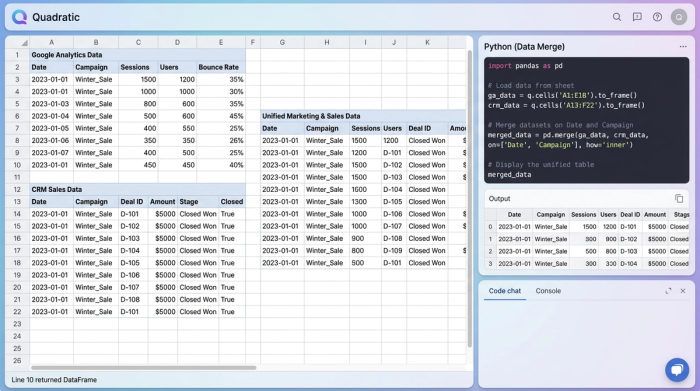
In Quadratic, you can use Python to perform a robust, accurate join. By using a simple Python script with the Pandas library, you can merge the web traffic dataset with the CRM dataset based on the unique identifier. The script can handle thousands of rows instantly, filtering out unmatched leads and aligning the data perfectly.
The result is a clean, unified table right in your spreadsheet. You can see "Campaign A" sitting directly next to "Closed Deal: $10,000," providing a clear visual link between the ad spend and the financial outcome.
3. Calculating custom ROI metrics
This is where the analysis moves beyond what competitor tools or native GA4 reports can offer. Once the data is joined in Quadratic, you are free to calculate metrics that reflect your specific business model.
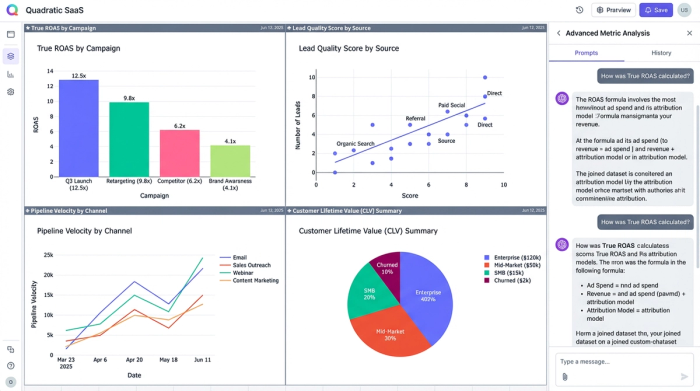
You can calculate True ROAS by dividing the actual closed revenue from the CRM by the ad spend for that specific campaign, or determine customer lifetime value by blending acquisition data with real revenue. You can develop a Lead Quality Score by analyzing what percentage of web leads from a specific source actually reached the "Proposal Sent" stage. You can even measure Pipeline Velocity, determining if leads from "Organic Search" move through the sales cycle faster than those from "Paid Social." These insights allow you to reallocate budget based on profitability rather than just lead volume.
Strategic benefits of external analysis
Moving your attribution analysis into a tool like Quadratic offers strategic advantages beyond just better math. The primary benefit is transparency. In a "black box" attribution tool, you have to trust the software's logic. In Quadratic, you can audit the data yourself. If a revenue number looks incorrect, you can click the cell, view the Python code or formula, and trace the data back to the source immediately.
You also gain significant flexibility. GA4 imposes lookback windows (often 90 days) and specific attribution models (like data-driven or last-click). When you analyze the raw data yourself, you can build your own logic. You can look back six months or a year, and you can attribute value based on first-touch, last-touch, or a custom weighted attribution model that fits your sales cycle.
Finally, this workflow provides agility. You do not need to wait 24 to 48 hours for data to process and appear in GA4 standard reports. As soon as you have the raw exports or live connections, you can run the analysis in Quadratic, enabling near real-time decision-making.
Conclusion: closing the loop
Implementing Google Analytics offline conversion tracking is essential for any business that closes deals away from a checkout cart. However, simply pushing that data back into GA4 is often not enough to drive high-level strategy. To truly understand marketing performance, you need the freedom to manipulate, query, and audit your data without platform restrictions.
By moving your analysis into a flexible environment like Quadratic, you can bridge the gap between marketing activity and sales results. You stop guessing at ROI and start calculating it with precision, ensuring that credit is given where it is truly due. If you are ready to stop relying on incomplete dashboards and start seeing the full picture of your revenue, try Quadratic for your next attribution report.
Use Quadratic to analyze Google Analytics offline conversions
- Bridge the attribution gap: Consolidate web traffic data from Google Analytics with offline CRM outcomes in one flexible workspace.
- Perform robust data joins: Use native Python to accurately merge thousands of rows of web and CRM data based on unique identifiers, eliminating fragile spreadsheet formulas.
- Calculate true ROI metrics: Develop custom metrics like True ROAS, Lead-to-Close rates, and Average Contract Value, beyond standard GA4 reports.
- Gain full transparency and flexibility: Audit your data, customize attribution models, and extend lookback windows beyond GA4's limitations.
- Enable agile decision-making: Analyze data in near real-time, without waiting for slow platform processing, to quickly optimize marketing spend.
Stop relying on incomplete dashboards and see the full picture of your revenue. Try Quadratic.