
Marketing teams live in Google Analytics. Finance teams live in SQL databases or payment processors like Stripe. For years, this separation of data has created a friction point when trying to calculate the most important metric in growth: profitability.
While Google Analytics 4 (GA4) is the standard for tracking user acquisition and session behavior, relying on it for financial modeling has significant drawbacks. Calculating customer lifetime value Google Analytics natively often yields incomplete data. GA4’s built-in LTV reports are frequently capped at 90 days, subject to data sampling, and struggle to account for complex subscription renewals or upgrades that happen outside the browser environment.
Instead, you need a workflow that pulls acquisition context out of GA4 and blends it with your actual revenue tables to achieve a unified customer view. By adopting a "builder’s mindset," you can construct a flexible, transparent view of profitability that satisfies both marketing and finance.
The trap of "average" LTV in GA4
One of the most dangerous metrics for a growth team is a global average, which is why average LTV can be deceptive. If you simply take total revenue and divide it by total users, you miss the nuance of how different cohorts behave. A single "whale" customer can skew the average, hiding the fact that 90% of your traffic is churning within the first month.
When you attempt to track Google Analytics customer lifetime value using the platform's default "User LTV" metrics, you run into structural limitations. GA4 is event-based and excellent at telling you what happened during a session. However, it is not a billing system and its conversion tracking often misses offline conversions, recurring subscription charges that hit a credit card without a site visit, or refunds processed by customer support.
The solution for effective customer data analysis is to move away from static averages and toward cohort analysis. You need to see LTV based on when a user signed up and where they came from. This requires joining the "Source/Medium" data that GA4 captures perfectly with the "transaction history" data that lives in your internal systems.
Why you need to blend data sources
The disconnect between acquisition data and revenue data is the primary hurdle in accurate LTV modeling. GA4 knows that User 123 came from "Paid Search" via "Campaign B." Your database knows that User 123 has paid $50 a month for the last year and just upgraded to the pro plan.
Bridging this gap is notoriously difficult in traditional tools. Standard spreadsheets struggle when you try to export raw GA4 data and raw transaction logs; the row counts are too high, and VLOOKUP functions become fragile and slow. On the other end of the spectrum, enterprise data warehouses like BigQuery offer the power to join these tables, but performing SQL data analytics requires expertise and engineering time that most marketing analysts cannot access on demand.
This is where Quadratic serves as the bridge. As a connected spreadsheet that supports native SQL and Python, it allows you to pull in live datasets from multiple sources and join them in a single workspace. You get the flexibility of a spreadsheet interface with the data processing power usually reserved for data engineers.
Step-by-step: building an LTV model in Quadratic
To build a true profitability model, you need to reconstruct the user journey by linking the acquisition source to the cash register. Here is how a growth and finance team can execute this workflow inside Quadratic.
Step 1: Ingest acquisition data
The first step is bringing your acquisition context into the spreadsheet. You can import your GA4 data containing User IDs (or a common identifier), acquisition dates, Source, Medium, and Campaign names. Unlike standard spreadsheets that might choke on thousands of rows of event data, Quadratic handles this ingestion smoothly. This table serves as your "map," telling you where every user originated.
Step 2: Ingest revenue data
Next, you connect directly to your internal database (such as Postgres, MySQL, or Databricks) or import a clean export from your payment processor. This table should contain the transaction logs: User IDs, transaction dates, and transaction amounts. Crucially, this is "hard" financial data—the actual money in the bank—rather than the estimated conversion values often found in analytics pixels.
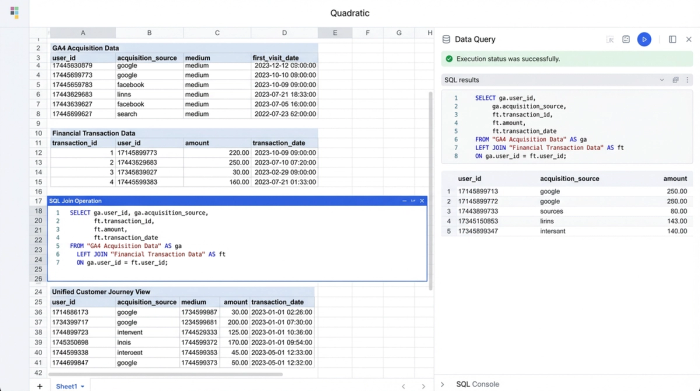
Step 3: The blend
This is the moment where the model comes together. In a traditional spreadsheet, you would be forced to write complex, brittle index-match formulas to link these two massive tables. In Quadratic, you can use a SQL cell to join the data instantly.
By writing a simple SQL query to join the Acquisition table with the Revenue table on the User ID, you create a unified dataset. You now have a single view that shows that User 123 came from "Facebook Ads" in January and has generated $500 in cumulative revenue as of today. This method is faster, more reliable, and easier to audit than a web of spreadsheet formulas.
Step 4: Creating the cohort view
With the joined data, you can now use Python or pivot tables within Quadratic to group users by their sign-up month (the cohort). You can calculate the cumulative revenue generated by each cohort over time (Month 1, Month 6, Month 12). This reveals the true curve of your customer value, and with proper data visualization, you can see if users acquired in January are more valuable than those acquired in June.
Analyzing the output: strategic decision making
Once this model is built, the insights derived from business data analysis often contradict the surface-level data found in GA4.
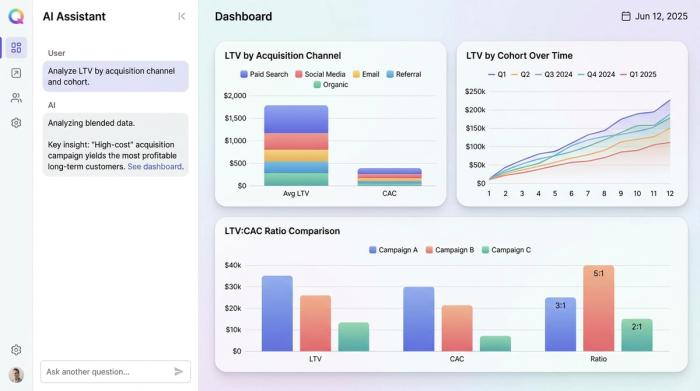
Consider a scenario where a specific marketing campaign ("Campaign B") has a high Cost of Acquisition (CAC). If you were only looking at the initial conversion value in GA4, this campaign might look like a failure. However, your blended Quadratic model might reveal that users from "Campaign B" have 3x higher retention rates than users from cheaper traffic sources.
Because you have connected the downstream revenue data, you can see that "Campaign B" is actually your most profitable channel over a 12-month period. This level of granularity allows you to compare LTV by:
- Landing page
- First-touch cohort
- Acquisition channel
- Specific marketing campaigns
Common definitions for your model
To ensure your model is readable by stakeholders across marketing and finance, it is helpful to align on standard definitions.
- CAC (Customer Acquisition Cost): The total sales and marketing spend divided by the number of new customers acquired in a specific period.
- LTV (Lifetime Value): The Average Revenue Per User (ARPU) multiplied by the average customer lifetime. In your cohort model, this is often calculated as cumulative revenue per user over a specific timeframe (e.g., 12-month LTV).
- LTV:CAC Ratio: The relationship between the value of a customer and the cost to acquire them. A ratio of 3:1 is a widely accepted benchmark for sustainable growth.
The "builder's" approach to analytics
Relying solely on the black box of customer lifetime value in Google Analytics limits your ability to make informed capital allocation decisions. When you let an automated tool estimate your profitability, you lose the nuance of your specific business model.
The most effective operators take a builder’s approach. They acknowledge that GA4 is the best tool for tracking the "click," but the database is the best tool for tracking the "cash." By using Quadratic to blend these worlds, you gain a transparent, flexible, and accurate view of your unit economics. This empowers you to stop guessing about ROI and start investing in the channels that actually drive long-term value.
Use Quadratic to calculate accurate customer lifetime value
- Blend GA4 acquisition data with actual revenue: Easily combine user acquisition context from Google Analytics with precise financial transactions from your databases or payment processors to overcome GA4's native LTV limitations.
- Move beyond average LTV with cohort analysis: Use native SQL to join large datasets for detailed cohort analysis, revealing customer lifetime value by acquisition channel, campaign, or sign-up date.
- Gain a complete and accurate financial view: Incorporate hard financial data from internal systems to account for complex subscription renewals, offline conversions, and refunds, providing a transparent and reliable LTV model.
- Make confident, data-driven investment decisions: Understand which marketing efforts drive long-term value, allowing you to optimize spending based on actual LTV:CAC ratios rather than incomplete metrics.
Ready to build your own accurate LTV model? Try Quadratic